Chapter 2 — The Economics of AI‑Driven Sovereign Operations
Summary
This chapter reframes cloud economics beyond simple infrastructure pricing, exposing the hidden costs that dominate the total cost of operating a sovereign, multi-cloud estate: incident exposure measured through MTTD and MTTR, the cognitive and financial burden of toil, regulatory fine risk under DORA and NIS2, talent attrition driven by repetitive work, and the opportunity cost of engineering capacity consumed by reactive firefighting. It demonstrates how sovereignty and multi-cloud amplify these costs through an ever-expanding operational surface area and a rising integration tax. The chapter presents agentic operations — AI-assisted correlation, remediation and workflow automation — as a structural economic response rather than an incremental efficiency gain, and introduces value metrics such as cost-per-incident, mean-time-to-context and automation coverage ratio that connect operational investment to measurable business outcomes. Architects and finance leaders will find guidance on constructing a pragmatic business case for a cross-cutting sovereign operations control plane.
2.1 Why the old cost model no longer works
For a long time, cloud economics was framed in relatively simple terms. Finance and technology leaders looked at unit prices for compute, storage and network across providers; they compared reserved instances with on‑demand, optimised their storage tiers, and negotiated discounts for committed spend. When operations came up in those conversations, it was usually as a supporting detail—headcount in the operations centre, licence costs for monitoring tools, maybe an estimate of overtime during major incidents.
That framing has become dangerously incomplete. As architectures have become more distributed, more regulated and more data‑intensive, the operational layer has emerged as a dominant source of cost and risk. It is not just about how many virtual machines are running, but about how much human and organisational energy is required to keep the estate functioning, compliant and resilient.
Several structural trends drive this shift. The first is complexity. A typical large enterprise now runs hundreds or thousands of services across AWS, Azure, Google Cloud, IBM Cloud and multiple data centres, with dependencies on SaaS platforms and partner systems. Understanding how those pieces fit together at any given moment is a non‑trivial task. The second is volatility. Infrastructure and application landscapes change daily, sometimes hourly, as teams deploy updates, spin up temporary environments and adjust capacity in response to demand. The third is regulatory pressure. As described in the previous chapter, regulators now treat operational resilience and sovereignty as ongoing obligations, not one‑off certifications.
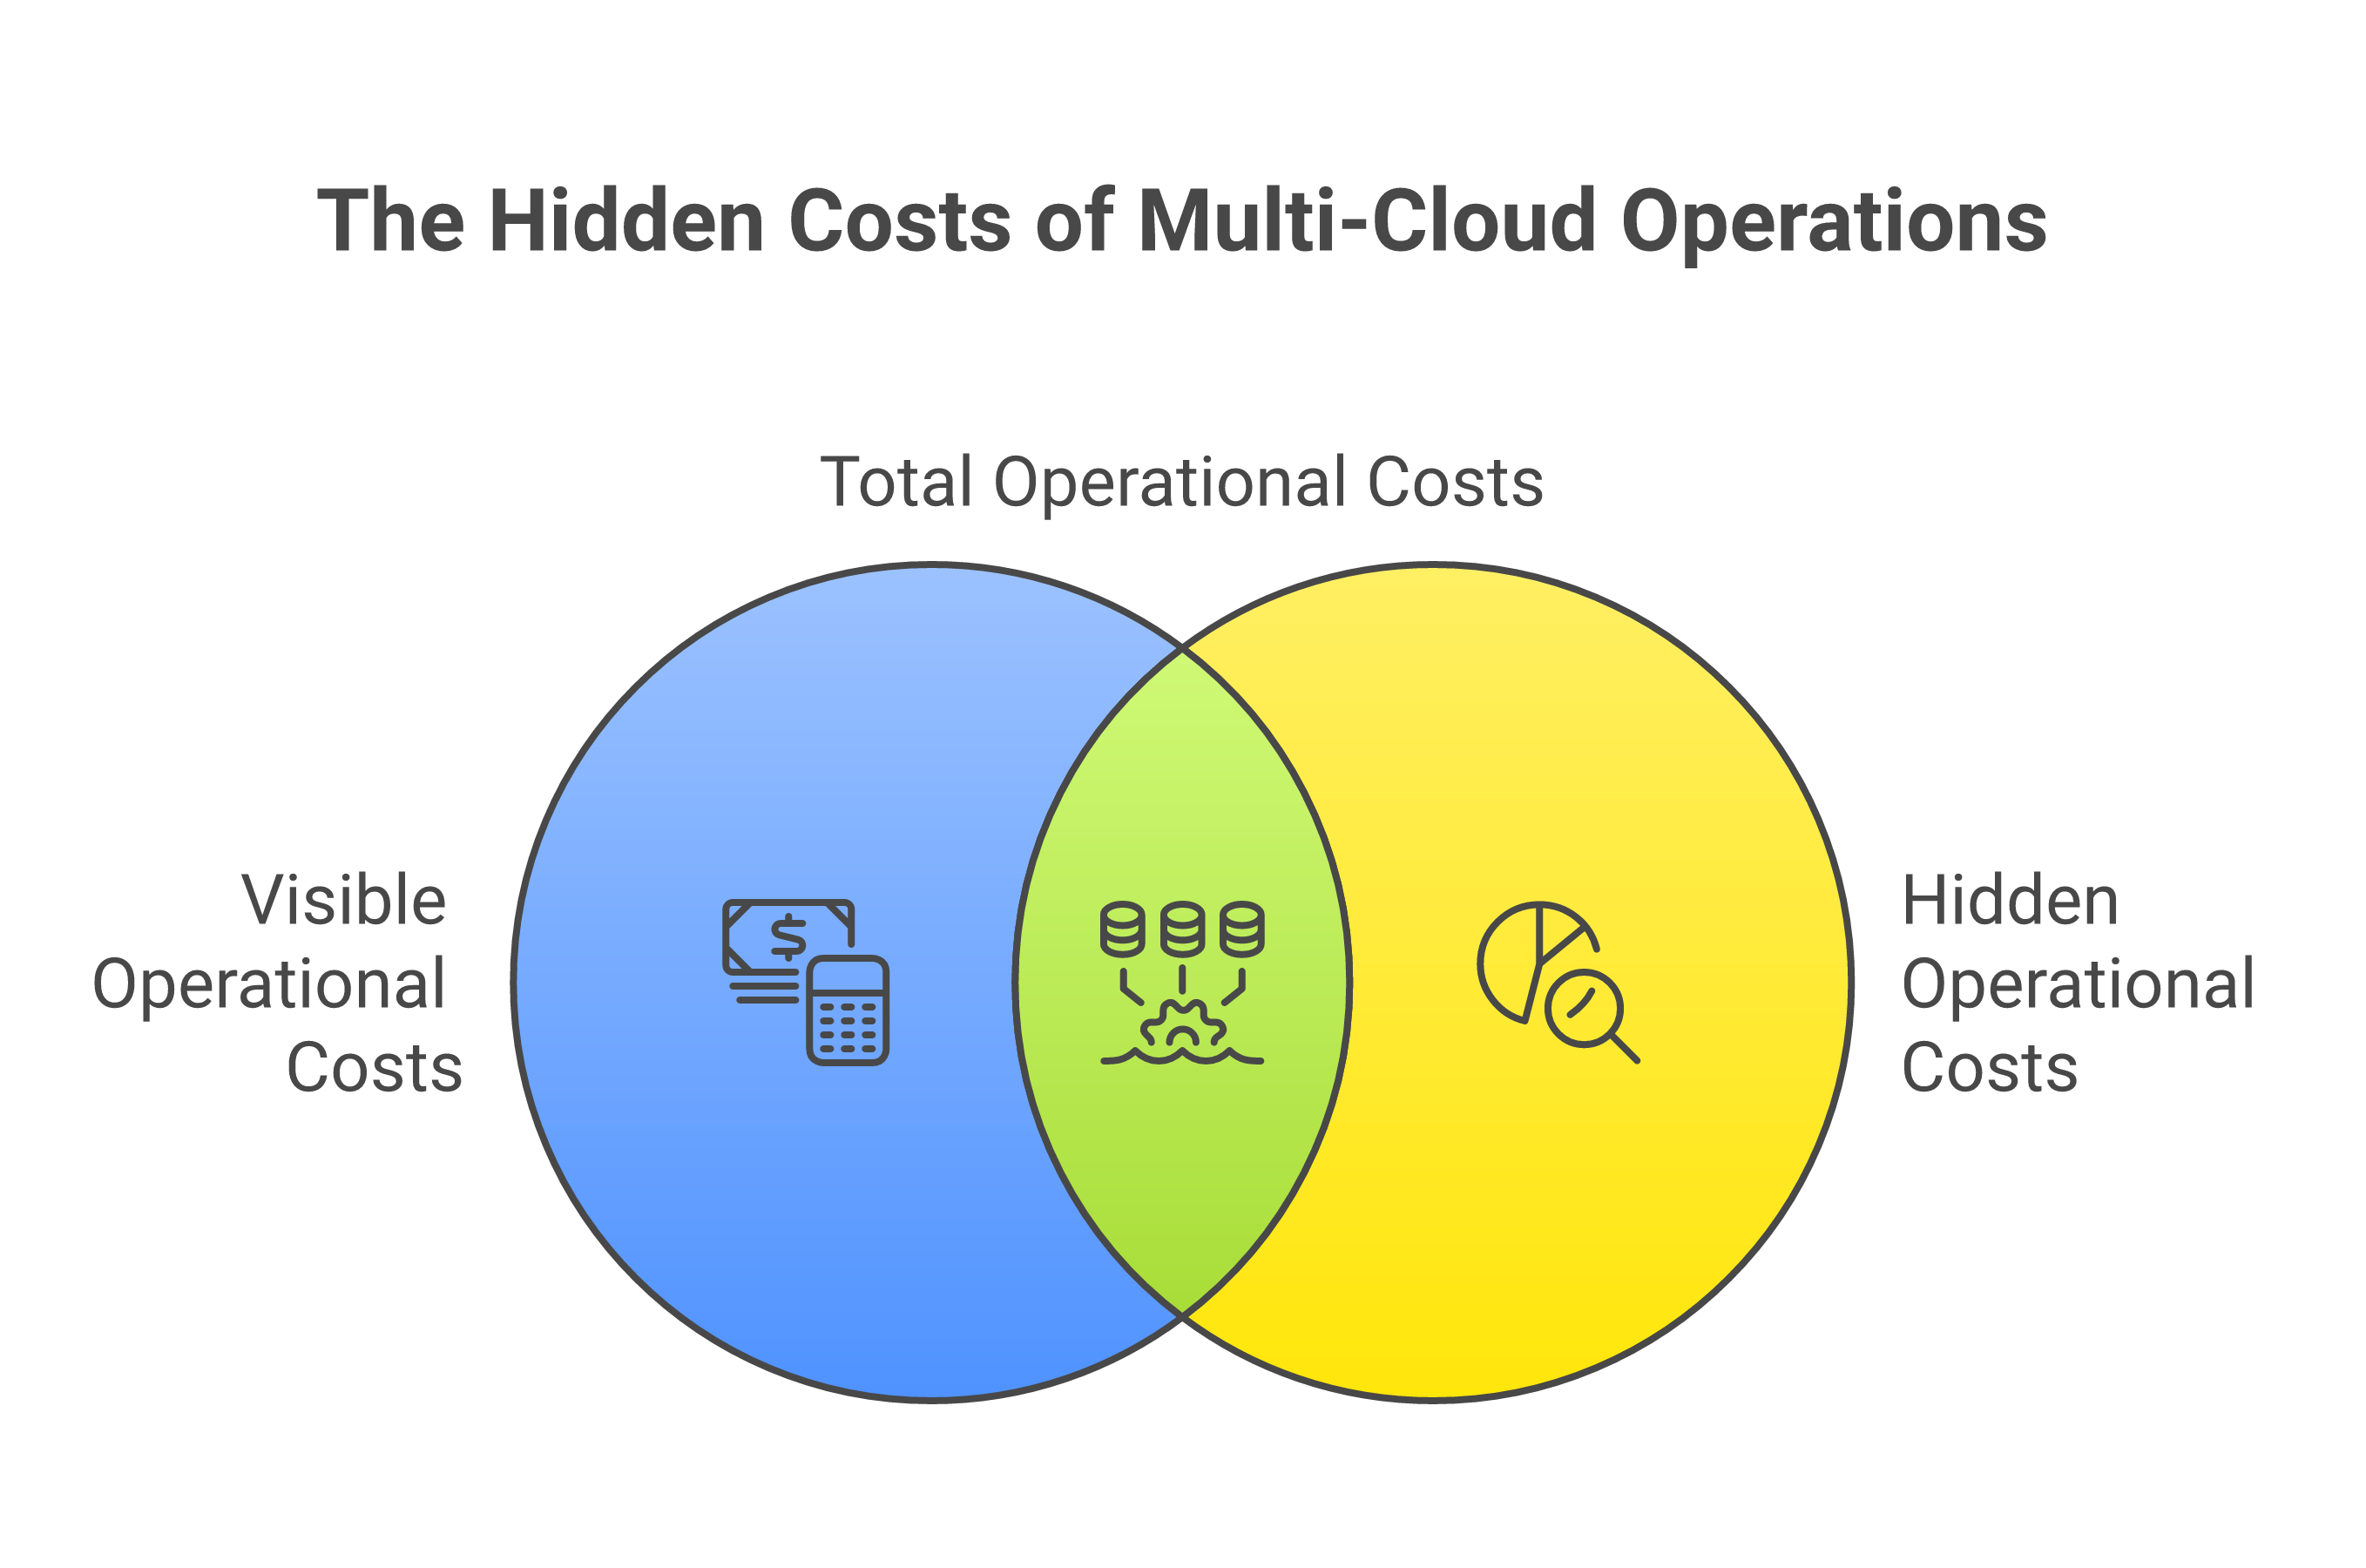
Under these conditions, the simplistic cost models of the past—focused primarily on capacity and licences—fail to capture the real economics of running a sovereign, multi‑cloud estate. They do not account for the cost of incidents, the cost of coordination, the cost of compliance, or the cost of opportunity lost when teams spend their time in reactive firefighting rather than in deliberate improvement. To navigate this terrain, organisations need to think about operations in economic terms as deliberately as they think about infrastructure.
2.2 The hidden costs of manual and fragmented operations
The most visible operational cost is the size of the operations team. But if we stop there, we miss most of the story. The real economic burden lies in the inefficiency of how that human capacity is used.
Consider a fairly ordinary major incident in a multi‑cloud environment. A key customer‑facing application becomes slow and error‑prone. Monitoring systems fire alerts in several channels. Engineers are paged from different teams: application, database, network, security, perhaps a cloud platform team. Each team turns to its own dashboards. One group is staring at container metrics in a Kubernetes console; another is looking at SQL query times; a third is sifting through logs; a fourth is examining recent security events.
For the first hour, a significant proportion of the organisation’s engineering talent is not fixing anything. They are trying to construct a shared mental model of what is happening. They copy links into chat, share screenshots, speculate about possible causes and try to recall similar incidents. Often, they discover that multiple teams are investigating the same symptom independently from different angles. Some investigations are redundant; others miss key context held by another group.
All of this has a cost. It shows up as lost revenue if the outage is customer‑visible. It appears as churn if customers experience enough friction to abandon services. It manifests as stress and burnout among engineers. Less obviously, it translates into lost capacity for planned work: every hour spent firefighting is an hour not spent paying down technical debt, improving resilience, or developing new features.
Mean Time to Detect and Mean Time to Resolve as cost drivers
Two industry‑standard metrics capture much of this hidden cost: Mean Time to Detect (MTTD) and Mean Time to Resolve (MTTR). MTTD measures the elapsed time between the moment a fault begins to affect the environment and the moment operations teams become aware of it. MTTR measures the elapsed time from awareness to full resolution. Individually, each metric tells a partial story; together, they expose the total window of exposure during which users, revenue and regulatory commitments are at risk.
Industry benchmark data illustrates the scale of the problem. The DORA research programme—now in its ninth year of longitudinal analysis—reports that elite‑performing engineering organisations achieve a median MTTR of less than one hour for service restoration, whilst low performers take between one and six days [1]. That is not merely a performance gap; it is an economic gulf. Research published by IBM’s Institute for Business Value estimates that the average total cost of a data centre outage, including lost revenue, productivity, recovery labour and reputational effects, exceeds one million US dollars for large enterprises when the outage extends beyond several hours [2]. Gartner research has consistently placed the average cost of IT downtime at approximately five thousand six hundred US dollars per minute, a figure that implies an hourly incident cost of over three hundred thousand dollars for major events [3].
The significance of these figures for the architectural choices described in this book is direct. Every hour by which the adoption of a correlated, cross‑cloud operational intelligence platform reduces MTTD represents a commensurate reduction in that exposure window. Every percentage‑point reduction in incident recurrence—through the kind of post‑incident learning that agentic architectures can systematise—compounds over time into a material reduction in total incident cost. The economics of investing in observability and agentic correlation are therefore most honestly evaluated not as overhead savings but as a reduction in expected loss, a framing that belongs on a risk register as much as an IT budget.
The cost of toil
Beyond incident response, there is a more diffuse but equally significant drain that Google’s Site Reliability Engineering practice has named toil. Beyer, Jones, Petoff and Murphy define toil as “the kind of work tied to running a production service that tends to be manual, repetitive, automatable, tactical, devoid of enduring value, and that scales linearly as a service grows” [4]. Toil is not the same as overhead or unpleasant work in general; its defining characteristic is that it produces no lasting improvement. Replacing a manually rotated API key is toil; automating the rotation process once and for all is engineering. Running the same diagnostic script every time a service degrades is toil; encoding that diagnostic into an automatic remediation agent is engineering.
The Google SRE framework targets a ceiling of fifty per cent of operations engineers’ time on toil, reserving the remainder for engineering work that reduces future toil or improves reliability [4]. In practice, many organisations operate well above that threshold. McKinsey’s research on AI in the enterprise suggests that in technology functions, between forty and sixty per cent of activities are “highly automatable” given current capabilities, yet adoption of automation remains partial and uneven [5]. The consequence is that skilled, expensive engineers spend large fractions of their working lives on work that machines could do—and would do more consistently.
Toil is not merely a cost problem; it is a retention and morale problem. Engineers who spend the majority of their time on repetitive, low‑autonomy tasks experience higher burnout rates and are more likely to leave. The replacement cost of an experienced senior platform engineer—recruiting, onboarding, and reaching full productivity—is typically estimated at one to two times annual salary. In a tight labour market for cloud and infrastructure skills, toil‑driven attrition is a direct financial risk that rarely appears in an operations budget but appears reliably in the talent and finance leadership’s quarterly concerns.
Regulatory fine risk
Fragmented, manual operations also carry explicit regulatory financial risk that has historically been underweighted in investment cases for operational tooling. Two frameworks are particularly relevant to enterprises operating in the European Union.
The Digital Operational Resilience Act [6] introduces a supervisory penalty regime applicable to financial entities and their critical ICT third‑party service providers. Whilst DORA itself delegates the setting of maximum penalties to member state competent authorities, the supervisory framework allows for pecuniary penalties of up to one per cent of the average daily global annual turnover of the financial entity for each day of non‑compliance during a continuing infringement, up to a maximum of five million euros for natural persons and higher ceilings for legal entities [6, Art. 50]. For critical ICT third‑party service providers, the lead overseer may impose periodic penalty payments of up to one per cent of average daily worldwide turnover [6, Art. 35]. More significant than the headline figures is the mechanism: supervisors can impose these penalties on a per‑day basis, meaning that a prolonged failure to demonstrate adequate incident management or dependency mapping capabilities carries compounding financial exposure.
The Network and Information Security Directive 2 [7] provides for administrative fines of up to ten million euros or two per cent of total global annual turnover—whichever is higher—for essential entities, and five million euros or one point four per cent of global turnover for important entities [7, Art. 34]. Again, the structure is per‑infringement, with member states retaining discretion to impose additional measures including temporary prohibitions on management functions. For an organisation with fifty billion euros in annual global turnover, two per cent represents one billion euros of maximum fine exposure for a single NIS2 infringement. These are not theoretical numbers; they belong in the value model of any serious investment case for operational resilience tooling.
Opportunity cost: engineering hours and product improvement
These costs are not confined to major incidents. They accumulate in smaller ways: in the time it takes to understand why a deployment failed, in the effort required to validate that a change is safe in a complex environment, in the overhead of coordinating maintenance windows across regions and providers, in the repetitive work of manually applying similar fixes to multiple systems. Fragmented tooling and fragmented processes magnify all of these.
Compliance adds another layer. When every significant change or incident must be documented, justified and sometimes reported externally, the burden of manual record‑keeping grows. Teams copy‑and‑paste logs into ticketing systems, write post‑incident reports from memory, and piece together timelines from chat histories and assorted tools. The effort is substantial, yet the result is often incomplete or inconsistent.
The opportunity cost dimension extends beyond compliance overhead. The Forsgren, Humble and Kim research underlying the DORA programme demonstrates that high‑performing engineering organisations—those with elite deployment frequency, lead time, MTTR and change failure rate—are not merely more efficient; they are structurally more capable of responding to market demands [8]. They can release new features faster, experiment more cheaply and recover from mistakes more quickly. Organisations mired in reactive operations, by contrast, find that the demand for firefighting consistently crowds out investment in improvement. The product roadmap is hostage to the operations backlog. This is not a failure of individual engineers; it is a structural consequence of under‑invested operational architecture.
These are the hidden costs of manual and fragmented operations. They rarely appear as a single line item in a budget. They are felt instead as a persistent sense that the organisation is always behind, always exhausted, always reacting.
2.3 Sovereignty, multi‑cloud and the rising operational tax
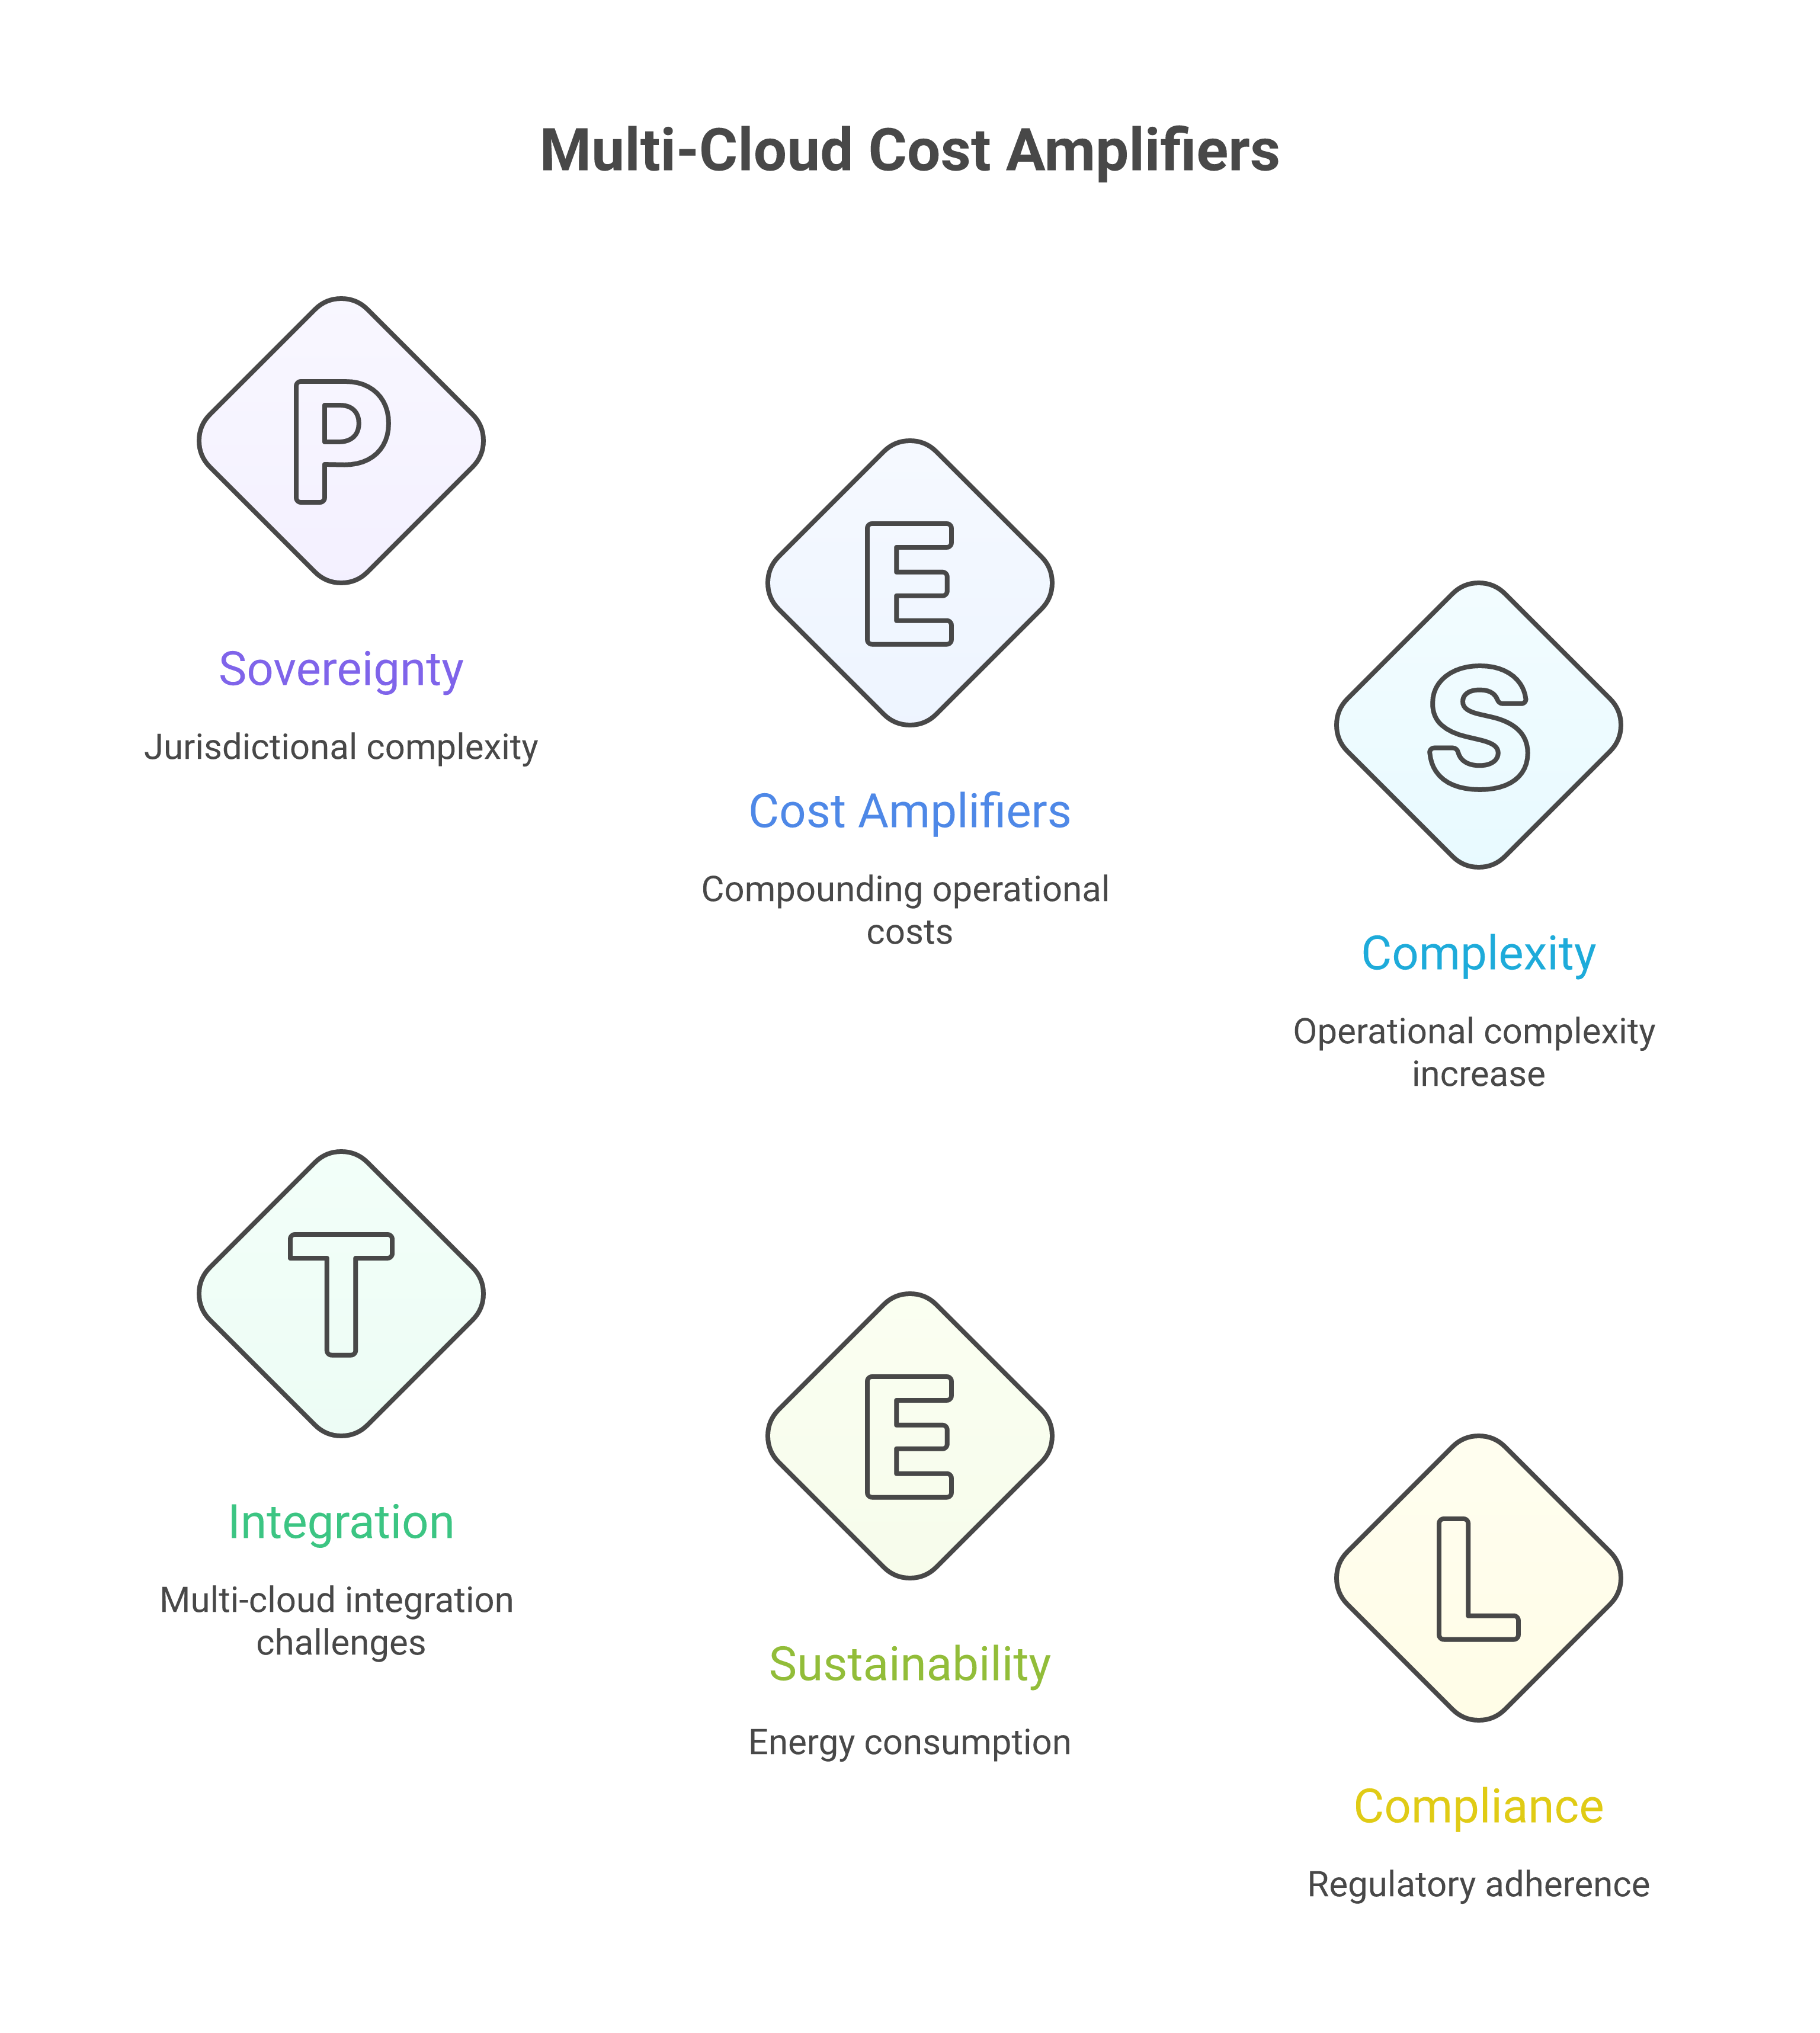
Sovereignty and multi‑cloud do not create these problems, but they amplify them. Every new jurisdiction brings its own data protection rules, breach notification requirements and expectations about who may operate which systems. Every new cloud provider brings a different set of abstractions, APIs and native tools. The operational surface area expands faster than the organisation’s ability to tame it.
Imagine a payment processing platform that runs across two public clouds and an on‑premises data centre, with data subject to European and national sovereignty rules. An outage affecting one region might have multiple plausible failover options in purely technical terms: route traffic to another region, another provider or a fallback system. But the set of permissible options is constrained by sovereignty commitments. Some destinations are off the table because they sit under the wrong jurisdiction; others require specific controls to be in place.
If the operational tooling does not understand those constraints, they exist only in people’s heads. Under pressure, those people are expected to weigh availability against compliance on the fly. They must remember which data classes can move where, which services have local copies of encryption keys, which network paths are acceptable. The risk of error is obvious. So is the cognitive load.
The integration tax
Multi‑cloud architectures are frequently justified on grounds of resilience and bargaining power. The argument is sound in principle; the implementation cost is consistently underestimated. Every provider exposes a different API surface, a different event schema, a different security model, and a different native toolset. When those providers must interoperate—whether for shared data access, federated identity, cross‑cloud monitoring or workflow orchestration—each connection requires a bespoke integration. That integration must be built, tested, maintained and updated whenever either provider changes its API.
Flexera’s annual State of the Cloud Report documents the scale of this problem across the industry. In the 2024 edition, ninety‑two per cent of respondents reported using multiple public clouds, and eighty‑seven per cent had a hybrid strategy combining public cloud with private or on‑premises infrastructure [9]. At the same time, managing cloud spend and optimising cloud usage consistently ranked as the top challenges, with organisations estimating that an average of twenty‑eight per cent of their cloud spend was wasted—predominantly through over‑provisioned resources and idle infrastructure [9]. The integration tax is invisible in that waste figure: it hides in the engineering hours spent maintaining point‑to‑point connections rather than in the cloud bill itself.
A large enterprise operating across three public clouds with distinct monitoring stacks, distinct ticketing integrations, distinct automation frameworks and distinct security toolchains may have dozens of integration points to maintain. Each integration is a potential failure point, a potential compliance gap, and a recurring demand on engineering capacity. As providers evolve their offerings—which they do continuously—each change ripples through integrations, requiring updates and re‑testing. The total cost of ownership of this integration estate is rarely modelled, but it is substantial.
Egress costs and data gravity
Multi‑cloud data flows carry a direct financial cost that compounds as architectures mature. Cloud providers charge for data egress—traffic leaving a provider’s network—at rates that vary by provider and region but are typically in the range of eight to nine US cents per gigabyte for traffic leaving to the public internet, with lower but non‑trivial rates for cross‑provider peering [9]. At scale, these costs are material. An organisation moving one petabyte of data per month between providers—not unusual in data‑intensive financial services, healthcare or manufacturing contexts—will incur egress charges of the order of eighty thousand to ninety thousand US dollars per month from egress fees alone, before accounting for the cost of ingress to the receiving provider.
The phenomenon of data gravity—the tendency of applications and processing to be drawn toward data rather than the reverse—means that as data accumulates in one cloud, the cost and complexity of accessing that data from another provider increases. This creates a structural lock‑in that operates independently of any contractual arrangement. Organisations that have not explicitly designed for data mobility find their multi‑cloud ambitions gradually eroded by the economics of data movement.
Zero‑copy architecture directly addresses the egress cost dimension. When analytical and operational access to data can be provided in situ—without physically moving the data to a different store or provider—the egress cost of operational intelligence falls to near zero. Concert’s topology and observability model can be built from data that remains resident in each provider’s environment, with only aggregated signals and summaries traversing provider boundaries. This is not merely an architectural elegance; it is a material reduction in the ongoing operational tax of multi‑cloud.
The compliance cost multiplier
Each new jurisdiction in which an organisation operates adds a compliance cost multiplier to the operational tax. Compliance costs are not linear—they do not scale simply with the number of users or the volume of data. They scale with the number of distinct regulatory regimes, each of which requires its own audit scope, its own evidence collection process, its own tooling configuration and its own staff training. An organisation operating across ten European Union member states, the United Kingdom and multiple non‑European jurisdictions may face a dozen or more distinct supervisory relationships, each with its own notification timelines, breach reporting obligations and supervisory expectations.
Research from IDC on the economics of compliance management in multi‑cloud environments suggests that organisations with more than three distinct regulatory jurisdictions spend between twenty‑five and forty per cent more on compliance operations than comparable organisations confined to a single jurisdiction, once the full cost of duplicate tooling, duplicate audit preparation and jurisdiction‑specific process overhead is accounted for [10]. The marginal cost of adding each new jurisdiction is lower than the initial cost, but it is never zero—and it is rarely budgeted honestly at the outset of geographic expansion.
The practical implication is that policy‑as‑code and centralised compliance automation are not optional refinements for large enterprises; they are the only credible path to managing jurisdictional complexity without proportionally expanding compliance headcount. If the compliance engine can be configured once, with jurisdiction‑specific policies expressed as code and applied uniformly across the estate, the marginal cost of a new jurisdiction falls to the cost of writing and validating a new policy set—rather than the cost of standing up a parallel compliance programme.
How zero‑copy architecture reduces the operational tax
Zero‑copy integration alters this equation in two significant ways. First, it reduces the forms of complexity arising from unnecessary data movement, consolidating analytical and operational access without requiring data replication across provider boundaries. Concert, operating against live topology and event streams rather than copied data stores, can provide cross‑cloud intelligence without the egress cost or the data residency risk of centralising data outside its sovereign zone.
Second, zero‑copy raises expectations about the reliability of the service fabric through which it operates, because if systems depend on live, cross‑site data access, the network and service fabric become more tightly coupled to business outcomes. Network congestion or policy misconfiguration in one location can affect services far away. The argument for a more sophisticated operations model becomes stronger, not weaker.
Multi‑cloud architectures are often justified by arguments about resilience and bargaining power. Done well, they can indeed reduce dependency on any single provider and allow more flexible use of services. Done badly—or operated without a coherent control plane—they simply multiply complexity. Each cloud’s native observability, automation and security tools are powerful in isolation but difficult to integrate into a cohesive whole. Attempts to standardise on a single toolset can run into provider‑specific gaps.
The net effect is an operational tax on sovereignty and multi‑cloud when they are not matched by an appropriate operations architecture. That tax consists of duplicated effort (multiple teams solving similar problems in different places), policy uncertainty (engineers unsure what is allowed), delays (changes waiting for manual approvals or cross‑team coordination), and risk (incidents handled in ways that technically solve the problem but quietly violate commitments). Architects who seek to reduce this tax will find that the strongest lever is not negotiating harder with providers but investing in the cross‑cutting operations plane.
2.4 Agentic operations as a structural response
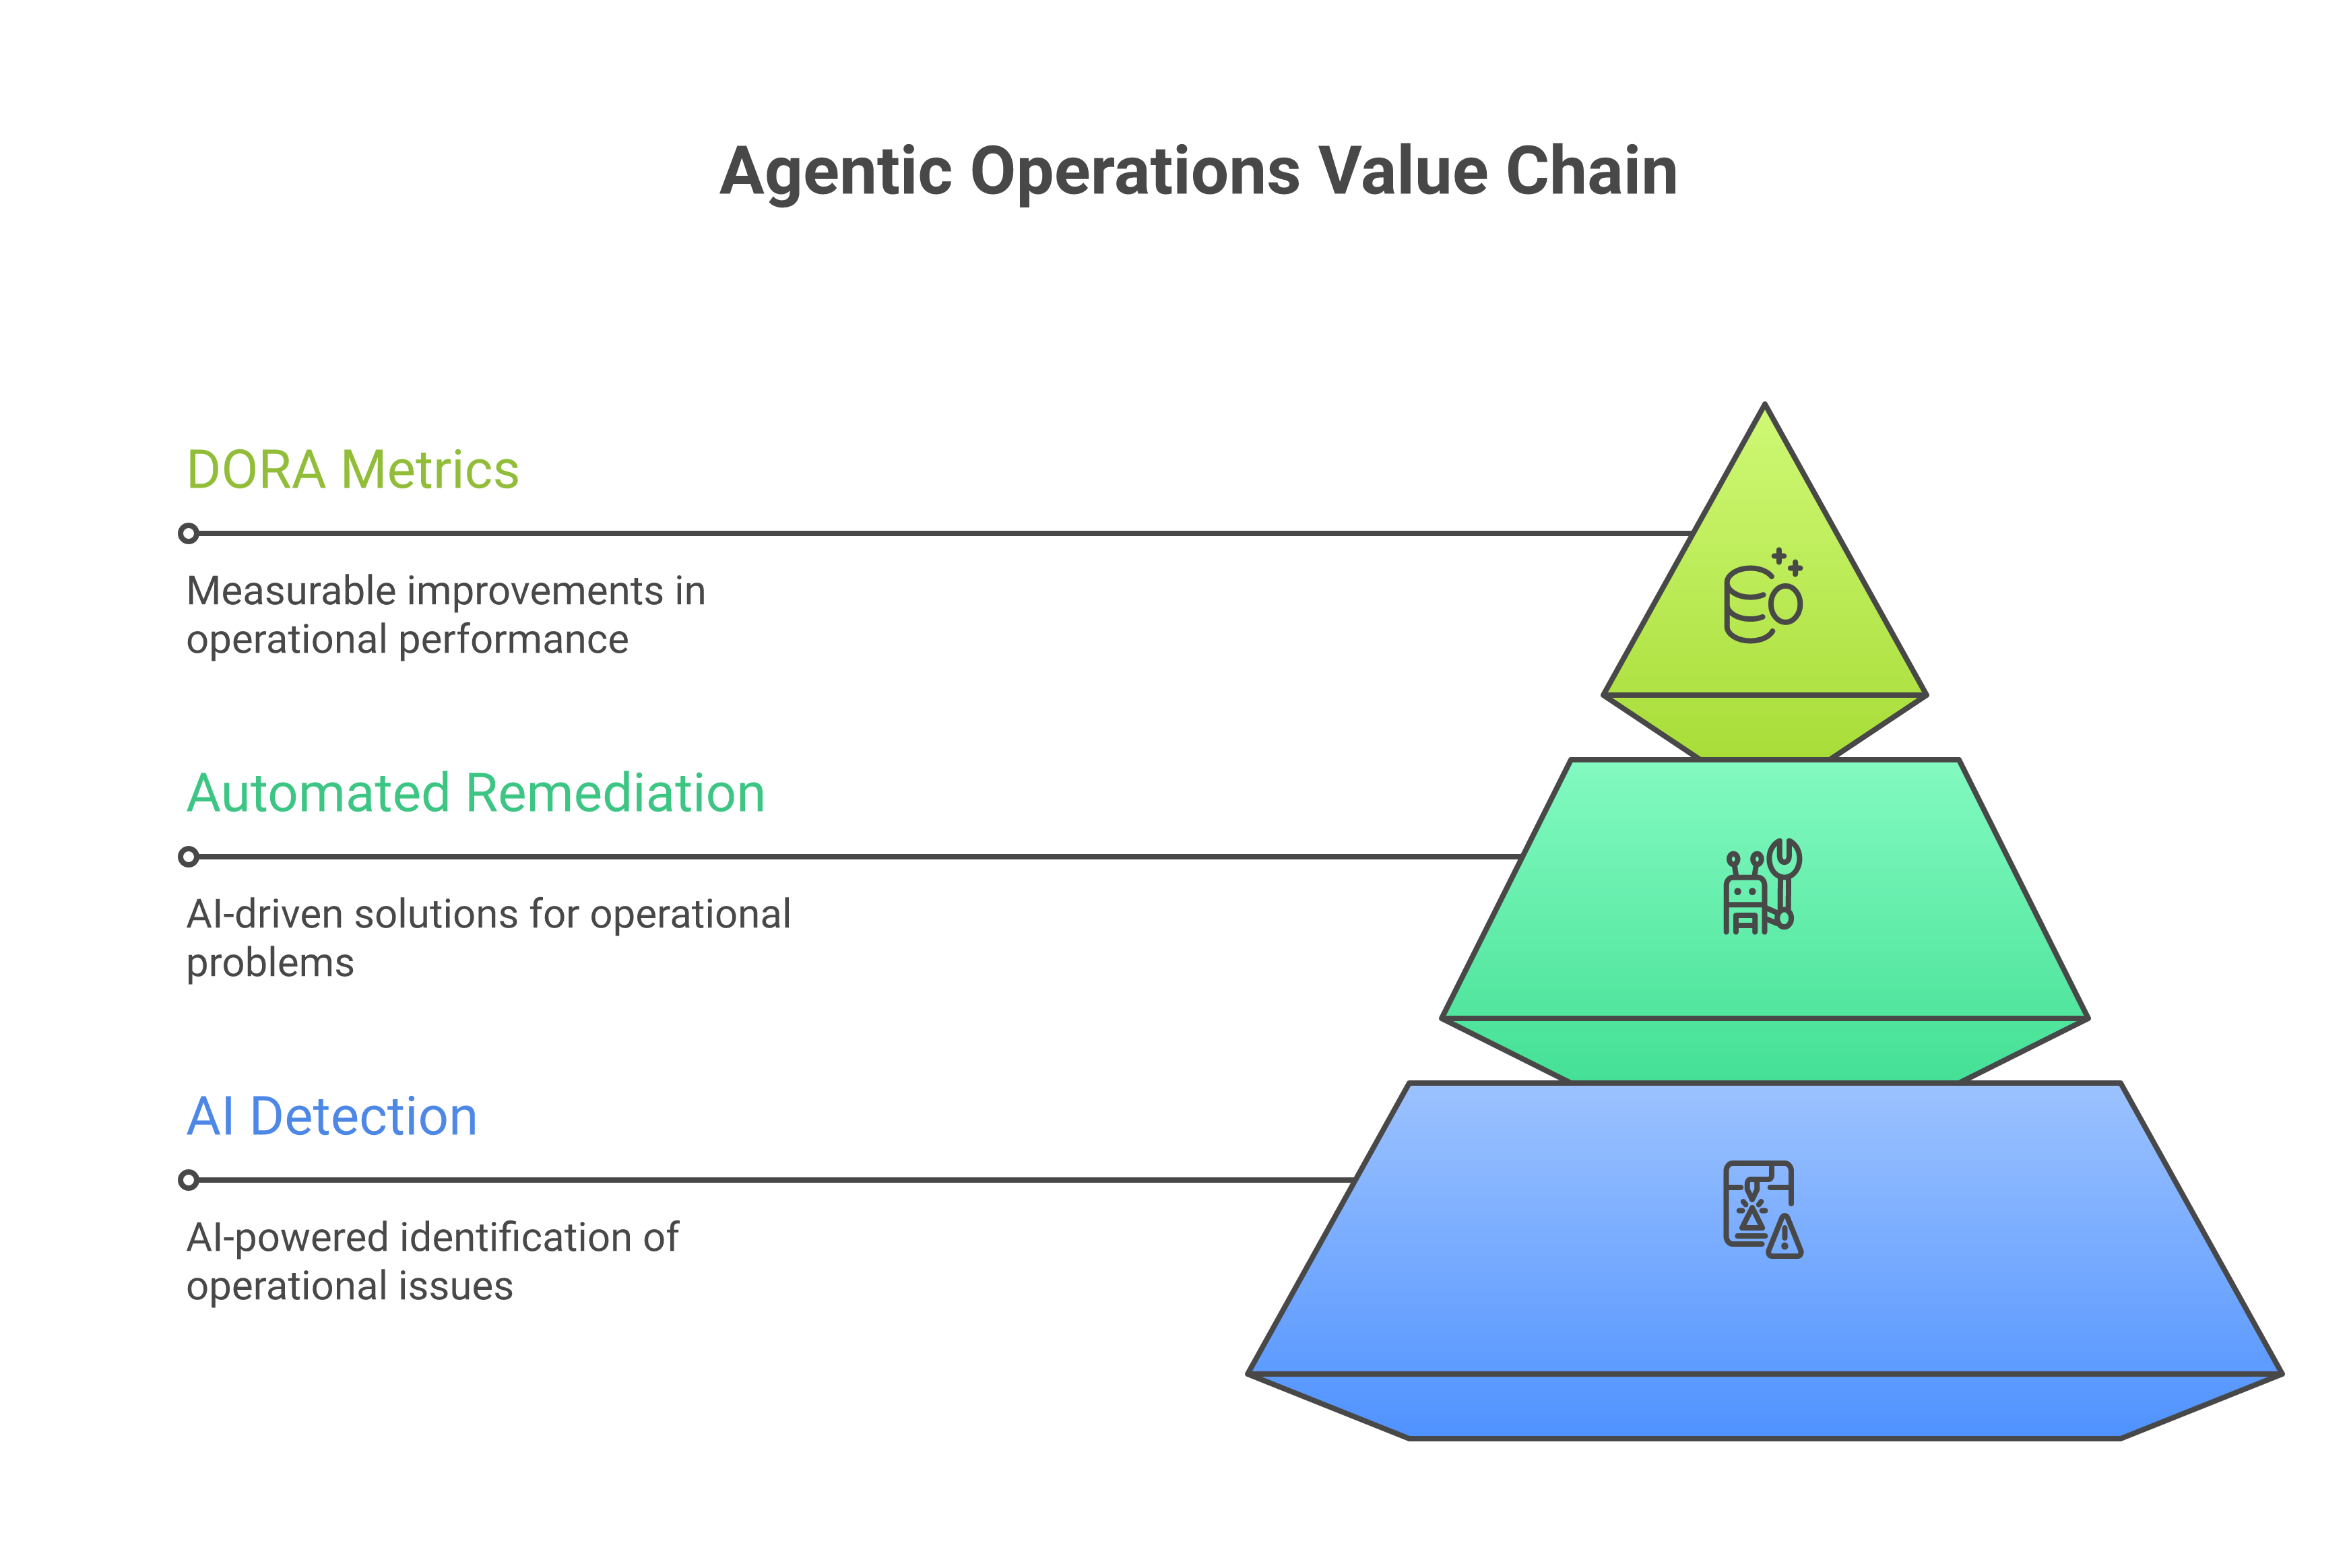
Agentic operations—the use of AI‑driven assistants and automated workflows as first‑class participants in operations—offer a way to change this cost structure at a deep level. They do not merely promise to “speed up” existing tasks; they enable a different division of labour between humans and machines.
The economic case for AI‑augmented operations
The economic logic of AI‑augmented operations rests on three compounding effects: reducing MTTR through faster context synthesis, reducing toil through automation of known procedures, and improving change success rates through risk‑aware tooling. Each of these effects is independently valuable; together, they produce a structural shift in the cost profile of operations.
On MTTR reduction, the IBM Institute for Business Value has found that organisations deploying AI‑assisted operations tools reduce their average incident resolution time by twenty to forty per cent compared with equivalent organisations relying on manual correlation and escalation processes [2]. This improvement is not primarily attributable to the automation of remediation—though that contributes—but to the acceleration of the diagnosis phase. When a system like Concert can surface a correlated, topology‑aware incident summary within seconds of the first alert, the time that human engineers previously spent constructing that shared understanding is recaptured. For an organisation experiencing fifty significant incidents per year, each averaging four hours to resolve, a thirty per cent reduction in MTTR represents sixty hours of collective engineering time recovered per incident event—time that can be redirected toward preventative engineering.
On change success rate, the DORA research distinguishes clearly between elite and low performers. Elite performers achieve a change failure rate below five per cent; low performers see failure rates of forty‑six to sixty per cent [1]. The financial consequence of a failed change in a regulated financial services environment is not merely the cost of rollback; it includes potential regulatory notification, customer communication, post‑incident review, and the reputational effect of repeated change failures. Tools like IBM Concert’s DevOps Insights capability assess change risk by correlating deployment history, test coverage, code churn and dependency maps, giving change approvers evidence‑based risk scores rather than intuition. This risk‑aware gate reduces change failure rates and, by extension, the incident cost they generate.
IBM Turbonomic: right‑sizing and avoided over‑provisioning
The economics of agentic resource management deserve particular attention because they represent a category of benefit that is immediately quantifiable in financial terms. IBM Turbonomic analyses application performance requirements and resource consumption patterns across the estate and generates recommendations—or, in fully automated modes, executes decisions—to right‑size virtual machines, containers and cloud instances.
Over‑provisioning is endemic in enterprise cloud estates. Flexera’s 2024 data shows that twenty‑eight per cent of cloud spend is estimated as wasted, with over‑provisioned resources as the largest single contributor [9]. For an organisation spending five hundred million US dollars per year on cloud infrastructure, twenty‑eight per cent waste represents one hundred and forty million dollars of annual over‑expenditure. Turbonomic’s approach of continuously matching resource allocation to actual application demand addresses this directly. IBM customer evidence consistently demonstrates five to thirty per cent reductions in cloud infrastructure spend following Turbonomic deployment, with the range depending on the degree of pre‑existing over‑provisioning and the maturity of the organisation’s cloud financial management practice [2].
Critically, Turbonomic makes these decisions through a closed‑loop economic model that is aware of both performance and cost objectives, rather than optimising for one at the expense of the other. It understands which workloads have performance SLAs that must not be compromised, and which workloads can be consolidated without user impact. In a sovereign multi‑cloud context, it can also incorporate sovereignty constraints: a recommendation to migrate a workload to a cheaper instance type in a different region will not be generated if that region falls outside the permissible sovereign envelope for that workload’s data class.
Turbonomic’s resource-level optimisation is most effective when complemented by financial management tooling that operates at the business and portfolio level. IBM Apptio [11] provides technology business management (TBM) capabilities that map infrastructure spend to business services, cost centres and value streams, giving finance leaders the taxonomy they need to evaluate whether sovereign operations spending is delivering proportionate business value. For Kubernetes-native workloads, Kubecost [12] provides container-level cost allocation that attributes cluster spend to individual namespaces, deployments and labels — critical in shared sovereign zone clusters where multiple teams or business units consume the same infrastructure and accurate chargeback is both a financial discipline and a governance requirement. For organisations operating across multiple cloud providers, IBM Cloudability [13] aggregates billing data from AWS, Azure, GCP and IBM Cloud into a unified cost management view, enabling cross-provider rate optimisation, commitment management and anomaly detection. Together, these FinOps capabilities ensure that the economic model of sovereign operations is visible, attributable and continuously optimised at every level from individual container to enterprise portfolio.
Concert recommendation acceptance rate as a productivity metric
A metric that usefully bridges operational effectiveness and economic value is the recommendation acceptance rate: the proportion of Concert’s recommended actions that operations engineers choose to accept, either immediately or with minor modification. This metric matters because it is a leading indicator of two things simultaneously. A high acceptance rate indicates that Concert’s recommendations are well‑calibrated to the organisation’s actual policies and risk tolerances, meaning that the model of the estate is accurate and the recommendation engine is earning trust. Conversely, a low acceptance rate may indicate either that the model is inaccurate—perhaps because the estate is poorly instrumented—or that the recommendation logic does not yet incorporate all relevant constraints.
As acceptance rates rise over time, the productivity benefit compounds. Each accepted recommendation that is automatically executed represents human time freed from manual action. Each accepted recommendation that the engineer reviews and approves—rather than initiating from scratch—represents a reduction in the cognitive load of deciding what to do. Over months, an organisation can observe a measurable shift in how its operations engineers spend their time: less execution, more oversight; less diagnosis, more validation.
The automation premium and DORA metrics
The Forsgren, Humble and Kim research provides perhaps the strongest empirical foundation for the economic case for automation maturity. Their longitudinal analysis of thousands of technology organisations demonstrates that high performers—those in the elite bracket on all four DORA metrics—are statistically significantly more likely to be operating in high‑automation environments [8]. This is not merely a correlation; the research uses structural equation modelling to demonstrate the directional relationship: automation capability drives performance improvement, which drives commercial and organisational outcomes.
The McKinsey Global Institute’s State of AI research corroborates this from a business performance perspective, finding that organisations in the top quartile of AI adoption in technology operations outperform their industry peers on both revenue growth and cost efficiency, with the operational effectiveness dimension being the most consistent driver of the gap [5]. Organisations that have automated their most common operational patterns—incident triage, change validation, capacity adjustment, credential rotation—spend proportionally less of their engineering capacity on reactive work, leaving more capacity for the architectural improvement and product development work that compounds business capability over time.
This automation premium is not an abstract concept. It manifests as measurable differences in deployment frequency, MTTR, change failure rate and lead time—the four DORA metrics—and those metric differences translate, through the causal mechanisms the research identifies, into differences in commercial performance, employee satisfaction and organisational resilience. Investing in agentic operations is, in this framing, investing in the capability to compete.
2.5 Rethinking how we measure operational value
It is tempting to express the value of automation and AI in terms of headcount reduction: “We can operate the same environment with fewer people.” In some narrow contexts that may be true. But as a guiding narrative for sovereign operations, it is both misleading and unhelpful.
In practice, most large organisations are not short of work for skilled operations engineers. They are short of time. They are short of the ability to say “no” to low‑value tasks. They are short of breathing space to do preventative work. Framing agents as a path to replacing people risks undermining trust precisely when trust is needed.
The four DORA metrics and their application to sovereign operations
The most rigorous published framework for measuring operational performance is the four‑metric set developed through the DORA research programme and described in detail in Forsgren, Humble and Kim [8]. These metrics—deployment frequency, lead time for changes, Mean Time to Restore (MTTR), and change failure rate—were designed to capture the two dimensions of software delivery that matter most: throughput (how quickly the organisation can move) and stability (how reliably it does so). The finding that these dimensions are not in tension—that elite performers are simultaneously faster and more stable than low performers—is the central empirical insight of the DORA research and the basis for its claim that investment in engineering practices produces commercial returns [8].
In a sovereign operations context, each of the four metrics takes on additional dimensions that are absent from a conventional software delivery analysis.
Deployment frequency measures how often code or configuration changes are successfully released to production. In a sovereign context, deployment frequency must be qualified by jurisdiction: a deployment that releases a change to a UK‑sovereign zone without affecting data in an EU‑sovereign zone is operationally distinct from one that crosses both. High deployment frequency in a sovereign context requires not just automation of the deployment pipeline but automation of the sovereignty constraint check—ensuring that each deployment is validated against the data residency, access control and key management rules applicable to the target environment before it is released.
Lead time for changes measures the elapsed time from a developer committing a change to that change running in production. In fragmented operational environments, lead time is dominated not by build and test duration but by approval queue time: change advisory board cycles, manual risk assessments, cross‑team coordination. Agentic tooling, by providing evidence‑based risk scores at the point of change request and by automating the execution of approved changes, compresses lead time without reducing the governance quality of the process.
Mean Time to Restore is the metric with the most direct financial relationship to the costs described in section 2.2. In a sovereign context, MTTR is influenced by the permissible remediation options available under sovereignty constraints. An organisation that knows in advance which failover paths are available under its sovereignty commitments—and has pre‑validated those paths—can execute recovery faster than one that must assess compliance at the moment of incident. Concert’s sovereignty‑aware topology model supports this pre‑validation by continuously mapping not just which failover options exist technically but which are permissible given the current policy state.
Change failure rate measures the proportion of changes that require remediation—rollback, hotfix, or emergency patch. In a sovereign context, a failed change may have regulatory consequences beyond the purely technical: a failed configuration change that inadvertently routes sensitive data through a non‑compliant network path may require regulatory notification under NIS2 or DORA, compounding the operational cost of the failure with compliance costs.
A more useful way to think about value beyond the four DORA metrics is in terms of three time‑based operational dimensions: time to understanding, time to change, and time to learning.
Time to understanding is the interval between noticing that something is wrong and having a plausible, shared explanation of why. In a fragmented environment, this can stretch out as teams consult different tools, argue over hypotheses and slowly converge on a picture. With a system like Concert, much of that work is front‑loaded: the model of the system is always being built, so when a symptom appears, the system can propose likely causes. Orchestrate can present that context conversationally, pulling in data from observability, tickets and code history. Reducing time to understanding by half can mean the difference between a minor blip and a major outage.
Time to change is the interval between deciding what needs to be done and having it safely implemented. Infrastructure as code and Git‑based workflows have already shortened this path. Agentic operations can compress it further. If an Orchestrate agent can open a pull request with the required Terraform change, trigger tests, update the relevant ticket and, once approved, apply the change through an automated pipeline, the overhead of execution drops dramatically. Engineers spend more time thinking about what should be done and less time on the mechanics of doing it.
Time to learning is the interval between an event and the organisation fully incorporating that experience. Every incident, near miss or anomalous pattern contains lessons. In many organisations, those lessons are partially captured in retrospective documents, if at all, and rarely reused systematically. In an agentic architecture, post‑incident timelines, commands, decisions and outcomes can be automatically assembled into structured records. Agents can mine these records to improve future recommendations. Bob can help turn recurring mitigation patterns into code or policies. The faster and more thoroughly the organisation learns, the less likely it is to repeat mistakes.
These time‑based measures connect directly to financial and risk outcomes. Shorter outages, fewer repeat incidents, more predictable change processes and better retention of organisational knowledge all contribute to lower costs and lower risk. They also improve the intangible experience of working in operations: fewer 3 a.m. emergencies, less frustration, more sense that the system is getting better over time.
2.6 The multi‑cloud advantage of a cross‑cutting control plane
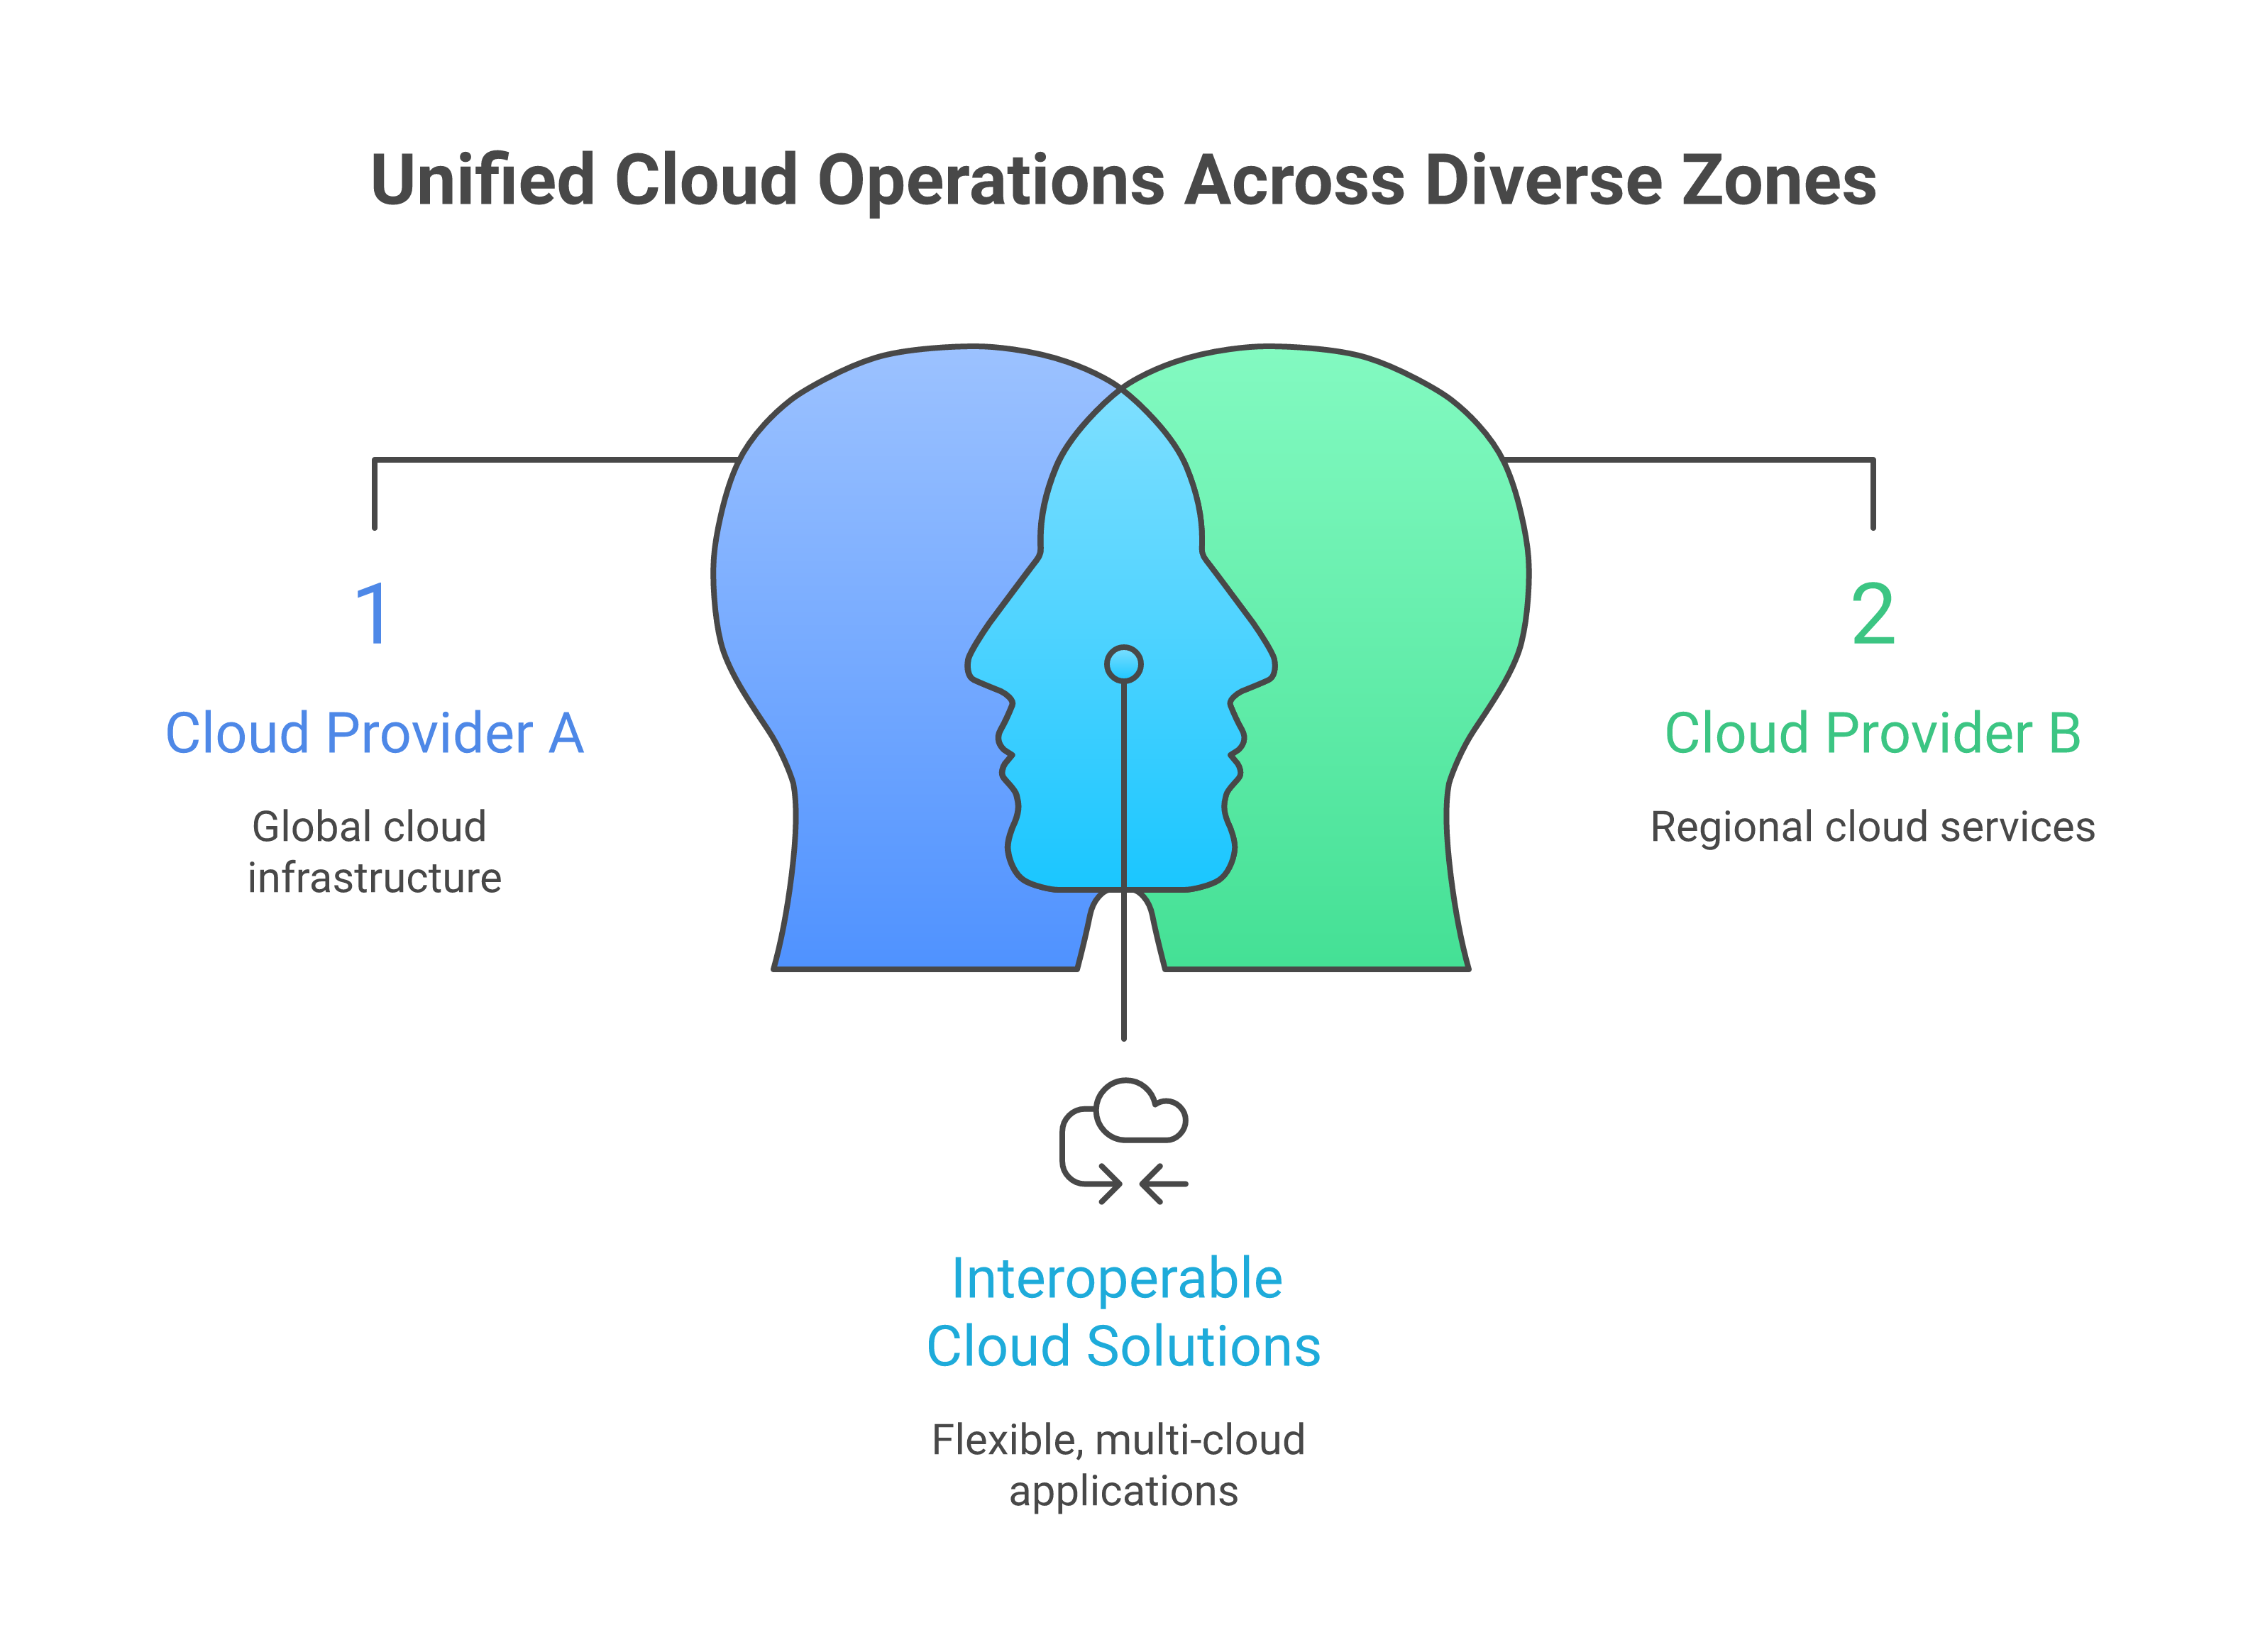
Multi‑cloud is often critiqued on economic grounds. Critics point out that using multiple providers can dilute discounts, complicate cost management and increase operational overhead. Those arguments are valid when multi‑cloud is pursued without a coherent strategy. But they overlook an important point: done right, multi‑cloud plus a cross‑cutting operations plane can be economically advantageous.
The key is standardisation at the operations layer, not at the provider layer. If each cloud is treated as an independent island with its own monitoring, automation, ticketing and workflows, every new provider multiplies cost and complexity. If, instead, the organisation invests in an operations plane that spans providers, the marginal cost of adding a new environment drops.
In this model, Concert becomes the source of truth for topology and health across AWS, Azure, GCP, IBM Cloud and on‑prem. Instana provides a consistent observability story across workloads, regardless of where they run. Turbonomic evaluates placement and capacity decisions across the estate, not just within a single provider. Orchestrate expresses workflows in terms of tools and APIs—Terraform, Ansible, ITSM, Git—rather than specific cloud consoles. Bob helps encode patterns and policies in code that can be applied in multiple environments.
Economically, this cross‑cutting approach has several benefits:
- Reuse of operational knowledge: A workflow for scaling a service, rotating credentials or handling a certain class of incident can be reused across providers, with cloud‑specific differences encapsulated in tools and modules.
- Reduced lock‑in: The cost of moving or rebalancing workloads is lower when operations do not depend on a provider’s proprietary tooling. Decisions about where to place workloads can be made based on cost, performance and sovereignty, not on operational inertia.
- Unified risk management: When resilience, security and sovereignty are managed at the operations plane, the organisation can see concentration risks and failure modes that span providers, not just those within a single cloud.
None of this is free. It requires investment in platforms, integration and skills. But the alternative—operating each cloud separately and relying on humans to bridge the gaps—has its own, often higher, costs. A well‑designed operations plane turns multi‑cloud from a liability into an asset.
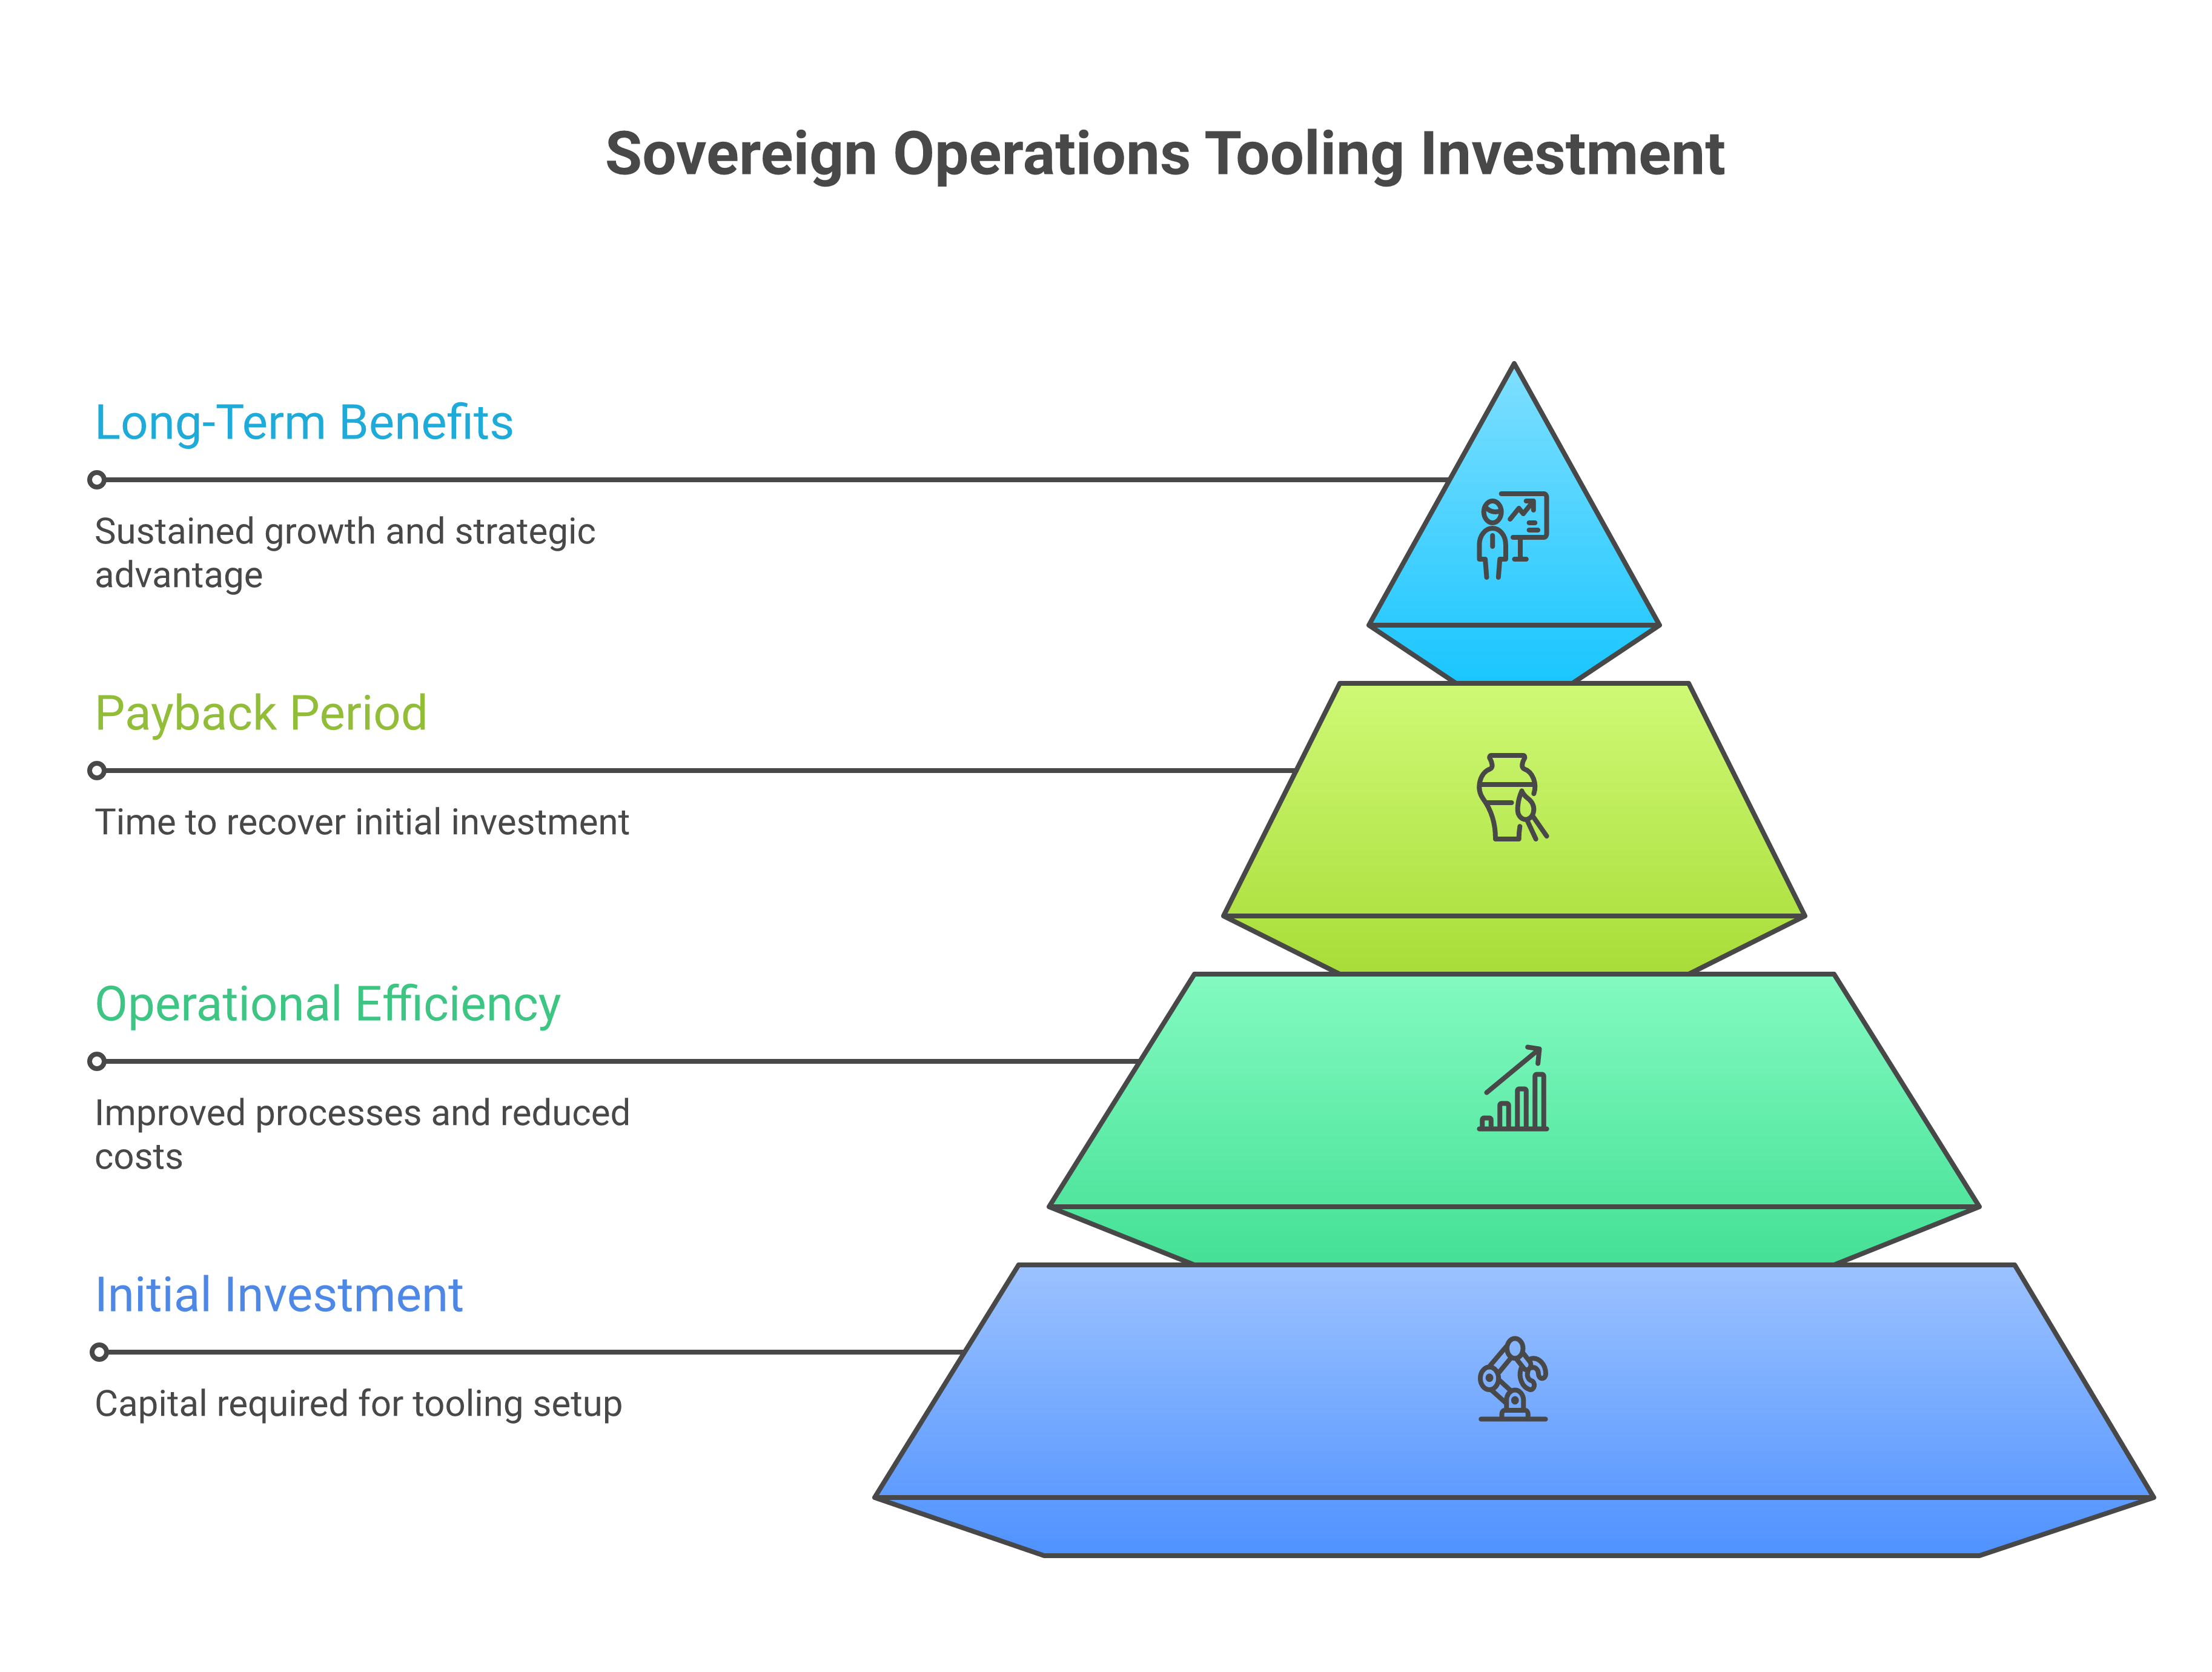
2.7 A pragmatic investment and payback view
It would be easy to present agentic sovereign operations as a straightforward win: invest in some platforms, train some models, and watch costs fall. Reality is messier. The transition is a multi‑year transformation, not a tool deployment.
In the early stages, costs may increase. New platforms must be acquired and deployed. Integration work must be done to connect existing systems. Teams must be trained not only in new tools but in new ways of thinking about operations. Some automation will be built twice: once in a prototype form and again in a more robust, governed fashion. There will be missteps and false starts.
The payback appears gradually. Often, the first visible benefits are local: a particular class of incident becomes easier to handle; a team finds that certain recurring tasks can be delegated to agents; a complex change that used to require days of coordination is reduced to hours. These wins matter, not only for their direct value but for their signalling effect. They show that the new approach is not just theory.
Over a longer horizon—two to three years—the pattern in successful organisations tends to converge. Incident metrics improve: fewer severe incidents, shorter duration, better communication. Change metrics improve: fewer failed changes, faster safe delivery of new features. Compliance posture stabilises: fewer surprises in audits, more confidence in evidence. Staff experience improves: lower burnout, higher retention, more time for engineering and less for repetitive toil.
Crucially, the organisation’s optionality improves. It can choose providers and architectures with more freedom, because it is no longer dependent on ad‑hoc, provider‑specific operational practices. It can respond to new regulations with adjustments to policies and workflows in the control plane, rather than scrambling to retrofit controls across a sprawl of systems.
This book is honest about the investment. It does not suggest that buying Concert, Orchestrate, Instana, Turbonomic, watsonx.governance and Bob, and wiring them together, will magically produce sovereign, low‑cost operations. What it argues is that, in a world of zero‑copy data, multi‑cloud infrastructure, and intensifying regulation, doing nothing is not a neutral choice. The costs and risks of manual, fragmented operations will continue to grow. Agentic, sovereign operations are not a luxury; they are one of the few credible ways to keep the economics of operations aligned with the ambitions of the enterprise.
2.8 Building the business case
An investment case for sovereign operations tooling is different in character from a conventional IT procurement business case. The primary driver is not efficiency in the narrow sense—it is risk reduction, regulatory obligation, and the preservation of strategic optionality. Presenting it as purely an efficiency play will undervalue it to a CFO, who is likely to be simultaneously managing conversations with Legal about DORA and NIS2 exposure, and with the Board about cyber resilience. The most effective investment cases connect the operational investment directly to those risk and regulatory narratives.
Establishing the baseline
Before a value model can be constructed, the organisation must measure its current state with precision. The baseline should capture four key parameters.
The first is current MTTD and MTTR, segmented by severity level. These figures are rarely as well‑known as organisations assume: many teams report average MTTR based on ticket closure times, which undercount the hours spent in informal coordination before a ticket is raised. A deliberate measurement exercise—reviewing actual incident records, correlating alert timestamps with resolution timestamps—typically reveals a true MTTR that is thirty to fifty per cent higher than the operationally assumed figure [1]. This gap itself becomes a finding that motivates investment.
The second is toil percentage. Following the methodology described in Beyer et al. [4], engineering teams can be surveyed and their time audited to establish what proportion of operational work is manual, repetitive, and automatable. The result—expressed as a percentage of total engineering hours—converts directly into an annualised cost when multiplied by the fully loaded cost rate of operations engineers. For a team of forty engineers at a fully loaded cost of one hundred and twenty thousand pounds sterling per annum, a toil percentage of sixty translates to 2.88 million pounds sterling per year spent on work that agents could perform.
The third is compliance cost: the direct operational spend on audit preparation, evidence collection, external audit engagements and compliance tooling, segmented by jurisdiction. This figure provides the denominator against which compliance efficiency gains from policy‑as‑code and automated evidence collection can be measured.
The fourth is the organisation’s regulatory fine exposure profile. Working with Legal and Risk colleagues, the operations investment case should include a probability‑weighted expected value of regulatory fines under current operational maturity. Given the DORA and NIS2 penalty structures described in section 2.2, even a small assessed probability of infringement at scale creates a significant expected cost that belongs in the risk‑adjusted value model.
Constructing the value model
With a measured baseline, the value model can be built around four benefit streams.
Incident cost reduction is the most directly quantifiable stream. Using the baseline MTTD and MTTR figures, and the industry benchmark cost‑per‑minute data from Gartner [3], the organisation can calculate its current annual incident cost exposure. Applying a conservative reduction factor—say, twenty per cent on MTTD from improved detection correlation, and thirty per cent on MTTR from agentic context synthesis and automated remediation—yields an expected annual saving. This saving is real, defensible, and auditable against actuals once tooling is deployed.
Toil elimination is the second stream. The toil percentage, multiplied by engineering cost, yields the annual spend on automatable work. Even if only half of that toil is automatable in the first three years of the programme, the value is material. More importantly, the recovered capacity can be directed toward the architectural improvement work that generates compounding returns in subsequent years.
Compliance efficiency is the third stream. Policy‑as‑code and automated evidence collection reduce the time operations teams spend on audit preparation and the cost of external audit engagements. IDC research suggests that organisations with mature compliance automation reduce audit preparation effort by thirty to forty per cent and external audit costs by fifteen to twenty‑five per cent compared with equivalent manual programmes [10]. These savings are recurring, and they grow in relative importance as regulatory complexity increases.
Fine avoidance is the fourth stream, and often the most persuasive when speaking to a CFO or a Risk Committee. The probability‑weighted expected value of regulatory fines—calculated from the baseline exposure assessment—is reduced as the organisation’s operational maturity improves and its ability to demonstrate continuous control increases. The reduction in expected fine exposure is a risk transfer, analogous in financial terms to the reduction in expected loss that an insurance premium provides. Unlike an insurance premium, it comes with the additional benefit of actually improving the organisation’s operational capability.
Phasing the investment
The sequencing of investment matters as much as the total quantum. A phased approach that generates visible early returns reduces the political risk of the programme and builds the organisational trust that more ambitious phases require.
Phase one should focus on observability consolidation and automated runbooks. Deploying Instana across the multi‑cloud estate, integrating its signals into Concert’s topology model, and encoding the ten most frequent incident patterns as automated runbooks in Orchestrate delivers measurable MTTD and MTTR improvements within three to six months of deployment. These improvements generate the first tranche of quantifiable value—and provide the instrumentation that makes subsequent phases more precise.
Phase two introduces structural changes: Concert’s full dependency mapping and AI‑assisted incident correlation, Turbonomic’s resource optimisation, and the automated evidence pipelines that reduce compliance overhead. This phase is larger in scope and requires more integration work, but it is built on the operational discipline established in phase one.
Phase three addresses the most sophisticated capabilities: fully agentic workflows with defined human‑in‑the‑loop approval gates, sovereign AI records governed through watsonx.governance, and the continuous resilience testing programmes that DORA requires of significant financial entities. By this point, the organisation has the baseline data, the operational trust and the regulatory evidence to demonstrate that the investment has performed.
Presenting the case to a CFO
Senior finance leadership will engage most readily with a business case that leads with risk and obligation rather than efficiency. The framing should be: “The regulatory landscape has changed in ways that impose specific, quantifiable financial obligations. Our current operational architecture does not provide the continuous demonstrable control that DORA and NIS2 now require. The cost of closing that gap is X; the expected cost of the current exposure—fines, incident costs, attrition, compliance overhead—is Y. Y exceeds X, and Y is growing.”
Supplement this with the DORA metrics baseline: show where the organisation sits relative to industry performance data, and show what the four‑metric improvement trajectory looks like over the programme’s three‑year horizon. CFOs are accustomed to risk‑adjusted investment cases; a well‑constructed one that connects operational tooling to regulatory obligation, expected loss reduction, and competitive position will compete effectively for capital against conventional revenue‑growth investments.
Key Takeaways
-
The real cost of manual and fragmented operations is dominated by hidden factors—MTTD and MTTR exposure, toil, compliance overhead, regulatory fine risk, attrition, and opportunity cost—none of which appear as single line items in an operations budget. Treating headcount as the primary cost driver produces systematically wrong investment decisions.
-
DORA penalties of up to one per cent of daily global turnover per day of continuing infringement, and NIS2 fines of up to ten million euros or two per cent of global turnover, represent quantifiable financial exposure that belongs in the value model for any investment in operational resilience tooling. These are not theoretical risks; they are the mechanism by which regulators convert operational failure into financial consequence.
-
The integration tax of multi‑cloud—point‑to‑point API integrations, egress costs, and per‑jurisdiction compliance overhead—constitutes an operational tax that grows non‑linearly with the number of providers and jurisdictions. The only credible path to containing this tax is a cross‑cutting operations plane rather than provider‑by‑provider optimisation.
-
Agentic operations address the structural economics of operations by reducing MTTR through accelerated context synthesis, reducing toil through automation of known procedures, and improving change success rates through risk‑aware tooling. The IBM Institute for Business Value evidence suggests twenty to forty per cent MTTR reductions are achievable with AI‑assisted operations deployment.
-
The four DORA metrics—deployment frequency, lead time for changes, MTTR, and change failure rate—provide the most empirically grounded framework for measuring operational performance. In a sovereign context, each metric acquires additional dimensions: jurisdictional qualification of deployments, sovereignty‑aware change risk assessment, permissible‑path‑aware recovery, and compliance consequence accounting for failed changes.
-
IBM Turbonomic’s closed‑loop resource optimisation directly addresses the twenty‑eight per cent cloud spend waste that Flexera’s 2024 research identifies as endemic across enterprise multi‑cloud estates. For an organisation spending five hundred million dollars per year on cloud, this represents up to one hundred and forty million dollars of recoverable spend.
-
A business case for sovereign operations tooling is most effective when it leads with risk reduction and regulatory obligation rather than efficiency alone. The expected value of fine avoidance, combined with incident cost reduction, toil elimination and compliance efficiency, typically produces a three‑year return that is quantifiable, auditable and compelling to senior finance and risk leadership.
Bridge to Chapter 3 — Regulatory and Compliance Drivers
This chapter has examined the economics of sovereign, multi‑cloud operations from three angles: the hidden costs that accumulate in manual and fragmented environments, the structural amplification of those costs that sovereignty and multi‑cloud introduce when not matched by a coherent operations architecture, and the economic case for agentic operations as a structural response. The central argument is that the old cost model—focused on capacity unit prices and headcount—is not merely incomplete; it actively obscures the dominant cost drivers. MTTD and MTTR exposure, toil, regulatory fine risk and opportunity cost together dwarf the visible costs that most operations budgets track. The DORA research programme and the IBM Institute for Business Value provide empirical grounding for the scale of these costs and for the improvements that automation and agentic operations can deliver.
Framing the investment case around risk reduction and regulatory obligation—rather than efficiency alone—is both more honest and more effective with the audiences that control capital allocation. DORA and NIS2 have converted operational maturity into a financial obligation with quantifiable maximum penalties. That conversion makes the business case for sovereign operations tooling structurally different from a conventional IT efficiency investment, and it should be presented as such.
Chapter 3 turns from economic arguments to the regulatory environment in detail. It examines how DORA, NIS2, GDPR, the EU AI Act and the guidance of national supervisors translate into concrete design requirements for the operations architecture—moving from the financial logic of investment to the legal and technical logic of obligation.
References
[1] Google Cloud and DORA Research Programme, “Accelerate: State of DevOps 2023,” Google LLC, Mountain View, CA, USA, 2023. [Online]. Available: https://dora.dev/research/2023/dora-report
[2] IBM Institute for Business Value, “Scaling AI with Trust: The Operations Imperative,” IBM Corporation, Armonk, NY, USA, 2023.
[3] Gartner, Inc., “Market Guide for AIOps Platforms,” Gartner Research, Stamford, CT, USA, 2023.
[4] B. Beyer, C. Jones, J. Petoff, and N. R. Murphy, Eds., Site Reliability Engineering: How Google Runs Production Systems. Sebastopol, CA, USA: O’Reilly Media, 2016. [Online]. Available: https://sre.google/sre-book/table-of-contents/
[5] McKinsey Global Institute, “The State of AI in 2023: Generative AI’s Breakout Year,” McKinsey & Company, New York, NY, USA, Aug. 2023. [Online]. Available: https://www.mckinsey.com/capabilities/quantumblack/our-insights/the-state-of-ai-in-2023-generative-ais-breakout-year
[6] European Parliament and Council of the European Union, “Regulation (EU) 2022/2554 of the European Parliament and of the Council of 14 December 2022 on digital operational resilience for the financial sector (DORA),” Official Journal of the European Union, vol. L 333, pp. 1–79, Dec. 2022. [Online]. Available: https://eur-lex.europa.eu/legal-content/EN/TXT/?uri=CELEX%3A32022R2554
[7] European Parliament and Council of the European Union, “Directive (EU) 2022/2555 of the European Parliament and of the Council of 14 December 2022 on measures for a high common level of cybersecurity across the Union (NIS2 Directive),” Official Journal of the European Union, vol. L 333, pp. 80–152, Dec. 2022. [Online]. Available: https://eur-lex.europa.eu/legal-content/EN/TXT/?uri=CELEX%3A32022L2555
[8] N. Forsgren, J. Humble, and G. Kim, Accelerate: The Science of Lean Software and DevOps: Building and Scaling High Performing Technology Organizations. Portland, OR, USA: IT Revolution Press, 2018. [Online]. Available: https://itrevolution.com/product/accelerate/
[9] Flexera, “State of the Cloud Report 2024,” Flexera Software LLC, Itasca, IL, USA, 2024. [Online]. Available: https://www.flexera.com/blog/cloud/cloud-computing-trends-flexera-2024-state-of-the-cloud-report
[10] IDC, “AIOps and Observability: Total Cost of Ownership and ROI Analysis for Multi-Cloud Enterprises,” IDC Research, Framingham, MA, USA, doc. no. US50397223, 2023.
[11] IBM Corporation, “IBM Apptio: Technology Business Management and IT Financial Management,” IBM Documentation, Armonk, NY, USA, 2024. [Online]. Available: https://www.ibm.com/products/apptio
[12] Kubecost, “Kubecost: Kubernetes Cost Monitoring and Management,” Kubecost Documentation, 2024. [Online]. Available: https://www.kubecost.com/
[13] IBM Corporation, “IBM Cloudability: Multi-Cloud Financial Management,” IBM Documentation, Armonk, NY, USA, 2024. [Online]. Available: https://www.ibm.com/products/cloudability
Sovereign Cloud Operations: AI-Driven Management of Sovereign Estates
© 2026 by Alan Hamilton
is licensed under CC BY-SA 4.0


