Chapter 9 — Events, Lineage, and Operational Signals
Summary
This chapter establishes that business events and data lineage are not auxiliary governance concerns but core operational signals in any distributed, event-driven, sovereign estate. It examines the observability challenges unique to event-driven architectures, including causal distance, consumer group lag, schema evolution and dead-letter queue management, and shows how the CloudEvents specification and OpenLineage standard make these signals machine-readable and interoperable across providers. Architects will find detailed guidance on event schema governance across sovereign zones — including schema registries, compatibility rules and sovereignty policy gates — as well as practical lineage query patterns for root-cause traversal, blast-radius assessment and regulatory data-flow proof. The chapter provides worked examples of sovereign event routing with intra-zone filtering, cross-zone redaction and policy-blocked egress, and explains how IBM Concert ingests event and lineage signals through dual-path mechanisms to correlate them with its topology model. Event sourcing as an operational pattern, the construction of SLOs in business-event terms, and the integration of event, lineage and data observability signals into agentic workflows complete the treatment.
9.1 Why events and lineage belong in the operations cockpit
Most operations teams grew up on a diet of infrastructure metrics and application logs. CPU spikes, memory pressure, disk saturation, error counts and generic latency graphs formed the core of the daily view. In a monolithic world, that was often enough. In a distributed, event-driven, zero-copy estate, it no longer is.
When systems communicate primarily through events rather than direct calls, and when those events represent meaningful business facts — “OrderPlaced,” “PaymentFailed,” “AddressUpdated” — then those events are themselves powerful operational signals. They tell you what the system thinks is happening in terms that business and risk stakeholders can understand. Ignoring them in favour of only low-level metrics is like flying an aircraft by watching engine temperature but never looking at altitude or airspeed. Kleppmann observes that in data-intensive, distributed systems, the event log is not merely a by-product of system activity; it is the primary record of what the system has done [1]. Treating it as anything less squanders its operational value.
The same is true of lineage. In complex estates, information rarely flows in straight lines. It passes through transformations, aggregations and projections. Understanding how a particular data point reached its current state — its lineage — is invaluable when something goes wrong, whether that “something” is a data quality incident, a regulatory breach or a mispriced transaction. Lineage is not only for data governance teams; it is a tool for operators who need to trace and fix problems quickly. The OpenLineage specification, now hosted under the Linux Foundation, was designed precisely to make lineage a machine-readable, interoperable artefact available to any system that needs it [2].
This chapter argues that events and lineage should be fully integrated into the operations cockpit. They are not “extra views” for specialists; they are core dimensions of how a sovereign, zero-copy, event-driven system behaves. The DORA Regulation (EU) 2022/2554 — the Digital Operational Resilience Act — makes this expectation explicit for financial entities: firms must maintain and exercise capabilities for detecting anomalous activities, reconstructing ICT-related incidents from their event records, and demonstrating control over the data flows underpinning critical functions [3]. Events and lineage are the technical instruments through which these regulatory expectations are met.
Executive Perspective
Events and lineage are the connective tissue between technical operations and business accountability. When a regulator asks how a particular data point reached a risk model, or when an incident responder needs to trace a failed payment back through a chain of asynchronous services, it is the event record and the lineage graph that provide the answer — or fail to. Organisations that treat these as secondary governance concerns discover the cost at the worst possible moment: during a regulatory examination, a data breach investigation, or a customer-impacting outage where mean time to resolution stretches from minutes into hours because nobody can reconstruct the causal chain. For the CIO, investing in standardised event fabrics and machine-readable lineage is an investment in operational speed, regulatory defensibility and the kind of institutional memory that does not walk out of the door when key engineers leave. It transforms “we think we know what happened” into “we can demonstrate exactly what happened,” which is the standard that regulators, auditors and boards increasingly demand.
9.2 Event-driven architectures and their operational challenges
Event-driven architectures (EDAs) enable loosely coupled, reactive systems in which producers publish events and consumers react to them asynchronously. This pattern is now common in e-commerce, financial services, IoT and many other domains. It underpins data mesh and streaming-centric architectures where data “in motion” is as important as data “at rest.” Apache Kafka, the dominant open-source distributed event streaming platform maintained by the Apache Software Foundation, has become the infrastructure substrate of choice for many large-scale EDAs, offering durable, ordered, partitioned event logs and a rich ecosystem of connectors, stream-processing frameworks and administrative tooling [4].
Before addressing the operational challenges of EDAs, it is worth establishing the four principal architectural patterns that practitioners encounter: event notification (a service emits a small message announcing that something happened, and consumers fetch details from the source), event-carried state transfer (the event payload carries all the data consumers need, a form of asynchronous synchronisation as Kleppmann describes [1]), event sourcing (all changes to application state are captured as an immutable sequence of events from which current state is derived by projection [5], explored further in section 9.4), and CQRS (the write side accepts commands and emits events while the read side maintains materialised projections optimised for query patterns). Each pattern creates distinct operational implications: event notification introduces hidden coupling through back-queries; state transfer enlarges payloads and demands careful schema evolution; event sourcing makes the log a primary operational asset; and CQRS means a single business operation may span multiple independently failing components.
These patterns are frequently combined, and their interactions multiply observability challenges. The fundamental difficulty is causal distance: the component that emits an event is often not the one that experiences the observable symptom. A defect in an upstream producer may only manifest as a downstream analytic anomaly hours later. Unlike a synchronous request-response call, where the caller receives an immediate error and a stack trace points to the origin, an EDA propagates consequences through a chain of event-driven reactions that can be arbitrarily long and branching [1].
Fan-out and fan-in compound this. One event may trigger many downstream actions; one service may depend on multiple event sources. Failures can therefore propagate in non-obvious patterns, and a single root cause may produce symptoms in dozens of consumers simultaneously, each looking like an independent incident to teams that lack cross-stream visibility.
Consumer group lag is one of the most important operational signals available in Kafka-based architectures, yet it is frequently underutilised. In Kafka’s consumer model, a consumer group reads from one or more topic partitions, and the broker maintains an offset representing how far each group has progressed through the log. The lag is the difference between the latest offset written by producers and the committed offset of the consumer group [4]. Rising lag is the earliest reliable indicator that a consumer is falling behind its upstream producers — it appears before timeouts, before errors, and before business metrics degrade. Operational dashboards that track consumer group lag by consumer group and partition provide a leading indicator of capacity, processing and connectivity problems. Concert’s event ingestion layer can consume Kafka consumer group metrics as first-class operational signals, allowing it to correlate lag spikes with topology changes or downstream service degradation.
Schema evolution is a persistent operational concern in EDAs. Unlike a synchronous API, where a version negotiation can occur at connection time, an event schema change affects all consumers of a topic simultaneously, including consumers that were written months earlier and may not be updated for some time. Apache Avro’s binary encoding format, combined with a Schema Registry — as provided by the Confluent Schema Registry and its open-source equivalents — addresses this through a compatibility enforcement mechanism [4]. Schemas are registered centrally; producers and consumers use schema IDs embedded in the message to retrieve the correct schema at runtime. The registry can enforce backward, forward or full compatibility rules, preventing producers from publishing schema changes that would break existing consumers. Operationally, schema registries must themselves be monitored as critical infrastructure: registry unavailability blocks producers and consumers alike, and schema compatibility check failures must surface as deployment-blocking signals rather than silent production incidents.
Kafka partition leadership and replication are further availability concerns. Kafka organises topics into partitions, each with a leader broker for reads and writes and follower brokers that replicate the log. Kafka availability depends not on overall cluster health alone but on the distribution of partition leaders across brokers and the replication factor of each topic. An uneven distribution — a “hot broker” — can cause throughput degradation even when the cluster appears healthy. Monitoring partition leader balance, in-sync replica counts and under-replicated partition counts are operational necessities for any estate relying on Kafka for critical event streams [4].
9.2.1 Event schema governance across sovereign zones
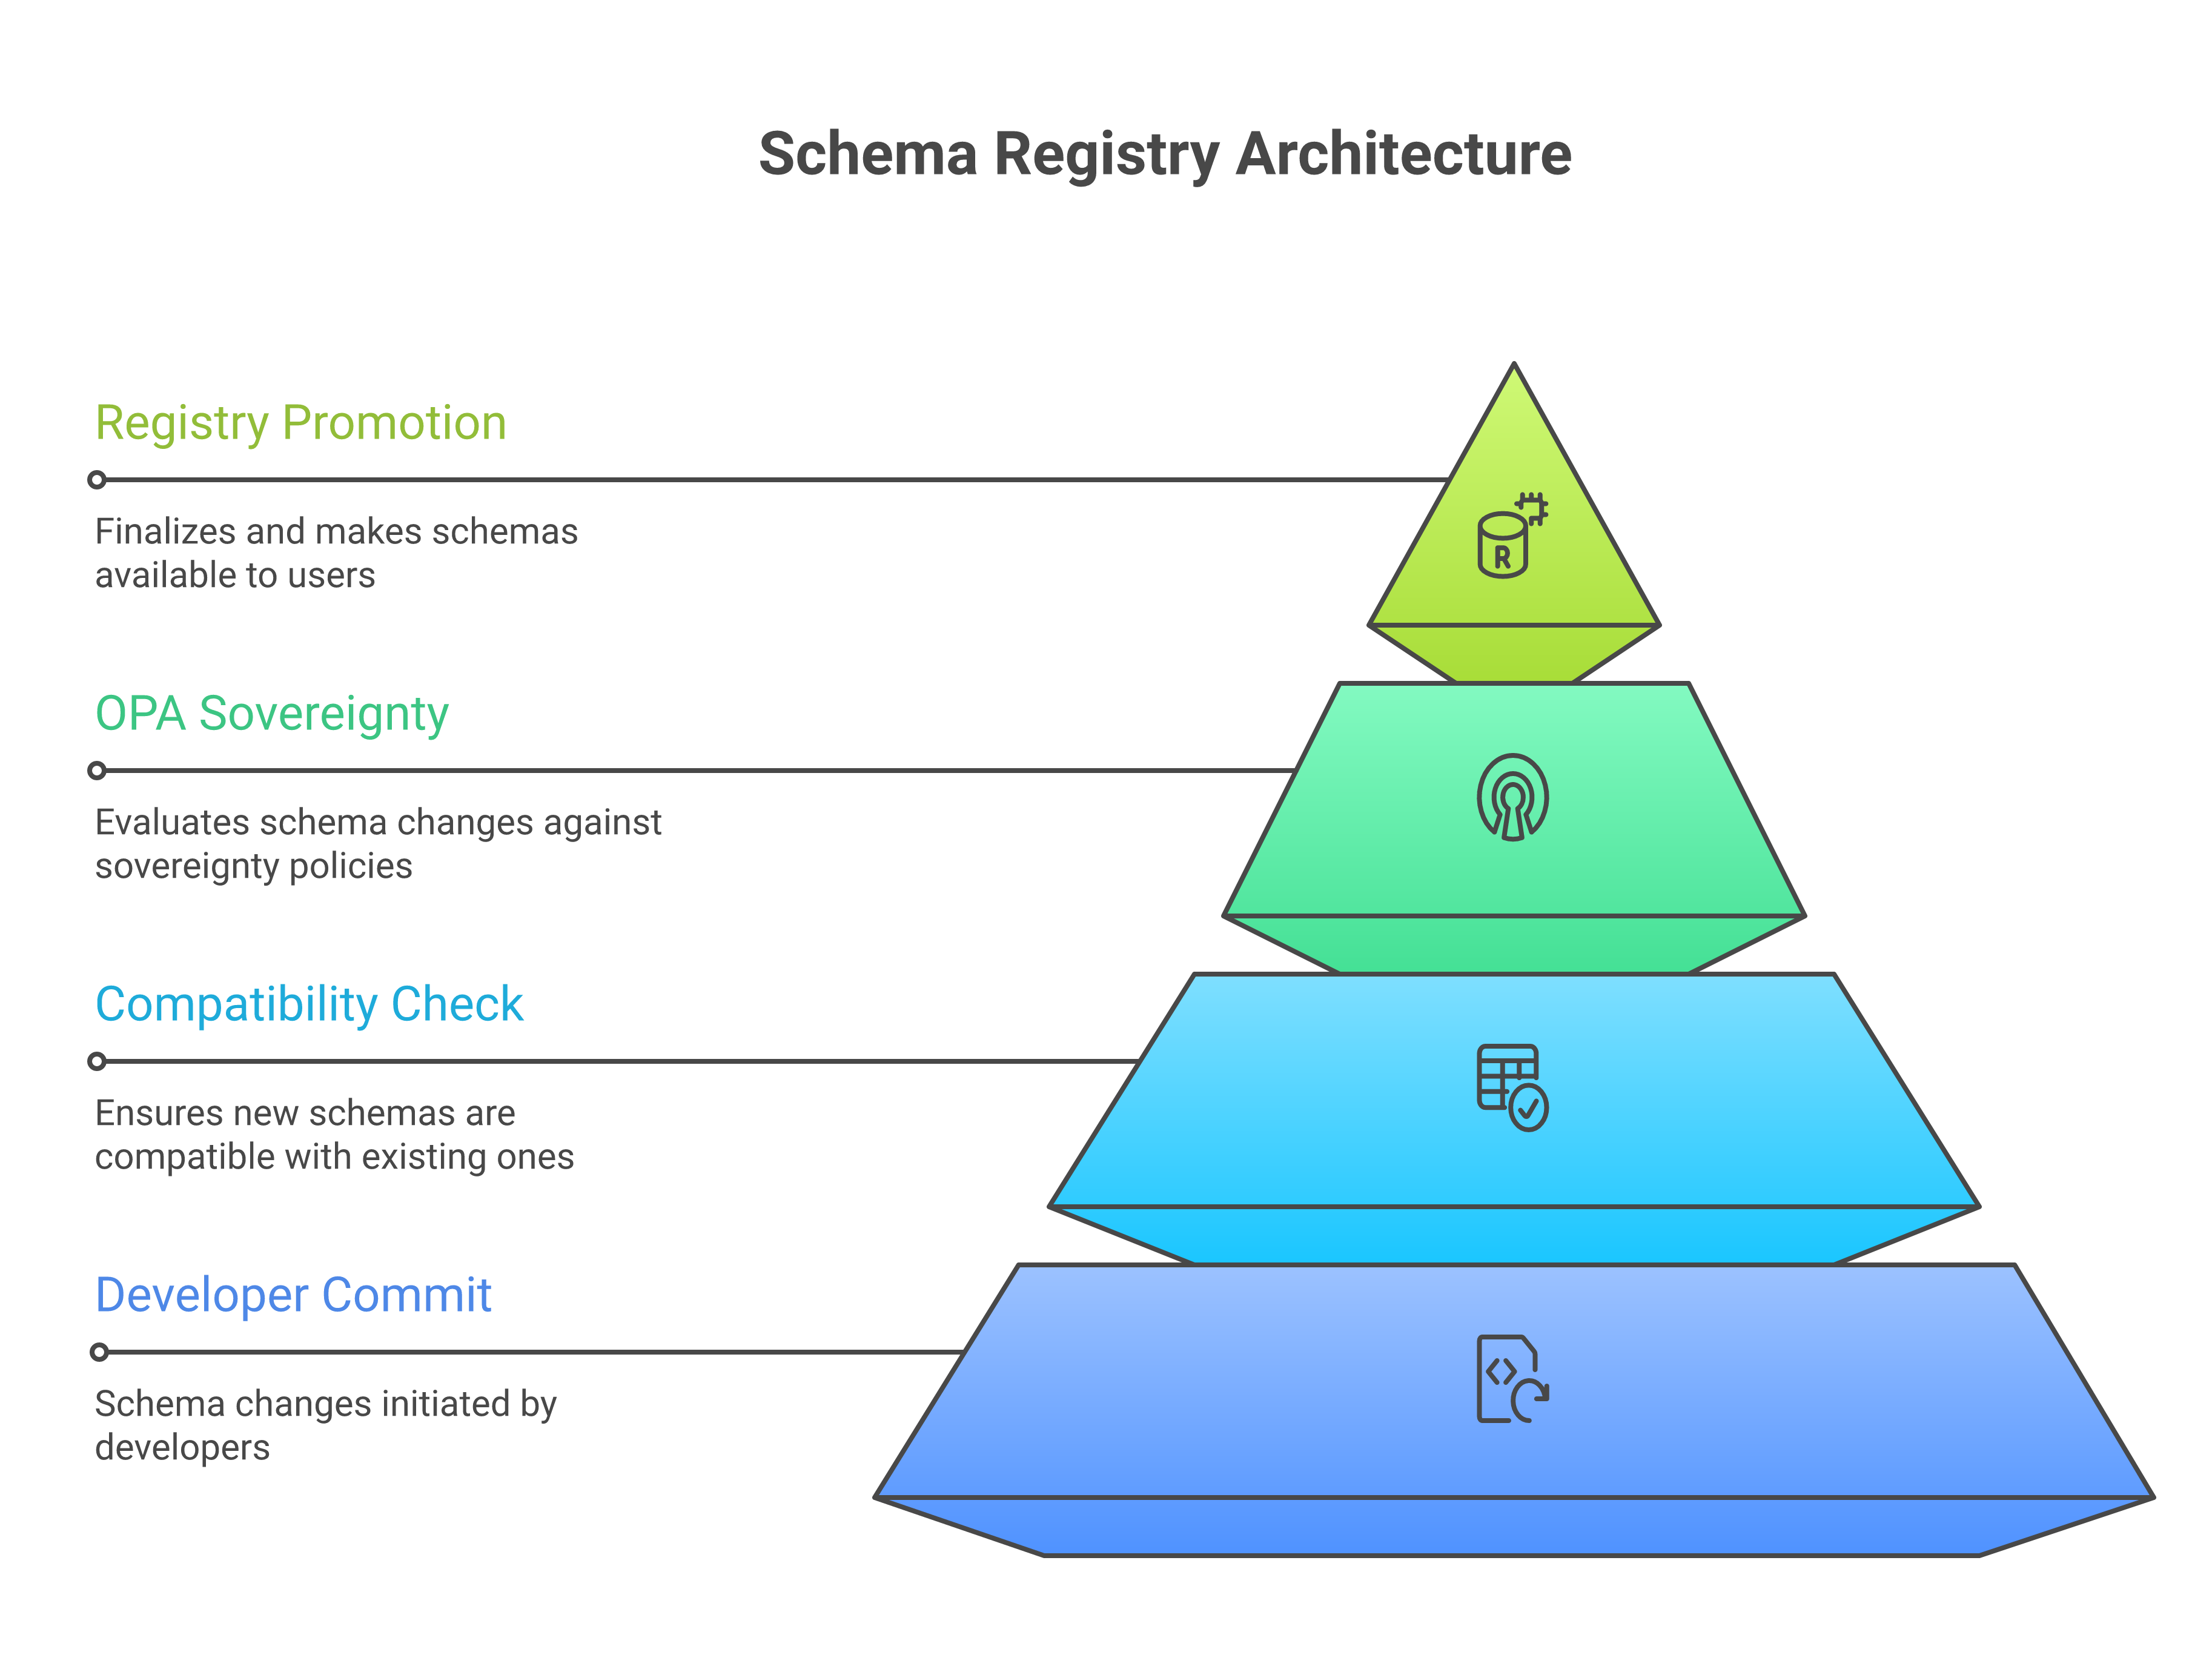
Schema evolution is not merely a development concern; at scale, it becomes a governance discipline. In a sovereign estate spanning multiple zones — each potentially operated by a distinct legal entity or cloud provider — schema changes must be coordinated across organisational and jurisdictional boundaries, not only across consumer codebases. The Confluent Schema Registry, the Apicurio Registry maintained by Red Hat, and similar implementations enforce backward, forward or full compatibility rules that prevent structurally breaking changes from reaching production [12]. For sovereign operations, however, a fourth consideration arises: jurisdictional compatibility. A schema change that adds a field containing personal data — for example, adding a customer_email attribute to an order event — may be technically backward-compatible yet legally non-compliant if consumers in a zone that prohibits processing of personal data for the relevant purpose would suddenly begin receiving that data. Schema governance policies must therefore extend beyond structural compatibility to include data classification review: every new field added to a schema that may carry regulated data should be tagged with its sensitivity classification, and the registry’s compatibility check should be augmented with a policy gate that evaluates whether the new field’s classification is compatible with the zones in which the topic’s consumers operate.
In practice, organisations implement this through a schema governance workflow that sits alongside the CI/CD pipeline. When a developer proposes a schema change, the change is submitted to the registry’s compatibility checker and, in parallel, to a policy-as-code engine (such as Open Policy Agent) that evaluates the sovereignty implications. The OPA policy receives the proposed schema diff, the data classification tags of any new or modified fields, and the list of consumer zones for the affected topic, and returns an allow or deny decision with an explanatory message. Only changes that pass both the structural compatibility check and the sovereignty policy check are promoted to the registry. This two-gate model ensures that schema evolution respects both technical and regulatory constraints without requiring manual review for every change.
A further operational challenge is the management of dead-letter queues (DLQs) and poison messages. Messages that fail processing — whether due to schema violations, missing entity references, or consumer logic exceptions — are typically moved to a DLQ where they can accumulate silently. Operations teams must monitor DLQ depth and age as first-class signals: a growing DLQ indicates a systematic processing failure, and the age of the oldest message reveals whether remediation is occurring. In Kafka, a consumer that has stopped committing offsets will show as high lag but zero DLQ depth, because messages are simply not being acknowledged rather than being moved. Understanding this distinction requires both lag monitoring and consumer error-rate instrumentation [4].
The combination of causal distance, fan-out, consumer group lag, schema evolution, partition leadership and dead-letter queue management means that EDAs require a more sophisticated observability strategy than their synchronous counterparts. Kleppmann observes that failure modes in distributed asynchronous systems are partial, gradual, and often visible only through downstream consequences [1]. The operational response must be correspondingly deliberate: richer instrumentation, more careful alerting thresholds, and incident playbooks that begin by asking “which event stream?” before asking “which service?” Traditional metrics help, but they do not convey the semantics of what is happening. Event-level signals fill that gap and, when properly instrumented, make the full causal chain of an EDA traceable.
9.3 Events as semantic operational signals
An event-driven system is constantly telling you a story about itself. Every event is a sentence in that story: “A user placed an order,” “A payment failed,” “An account was closed.” When you treat events as first-class operational signals, you start to read that story rather than only watching for abstract symptoms.
The CloudEvents specification, version 1.0, published by the Cloud Native Computing Foundation (CNCF) in 2019, provides a standardised way to describe event data in a common format [6]. Its design objective is precisely operational interoperability: when every event — regardless of origin — carries a standard set of metadata attributes, consumers can correlate, route and analyse events from heterogeneous sources without bespoke parsing logic. The mandatory CloudEvents attributes include id (a unique event identifier), source (a URI identifying the event producer), specversion (the CloudEvents version in use), and type (a reverse-DNS-style string describing the event’s nature, such as com.example.payments.authorised). Optional attributes include time (the RFC 3339 timestamp of the event’s occurrence), datacontenttype, dataschema and subject. For operational purposes, the combination of source, type and time provides the minimum metadata needed to correlate events across systems without inspecting their payloads [6].
The CloudEvents specification defines three content modes for encoding. In structured content mode, the entire envelope — context attributes and data — is encoded as a single JSON (or Protobuf, or Avro) document, making it self-describing. In binary content mode, context attributes are mapped to protocol-level headers (HTTP headers, Kafka record headers, AMQP application properties) and the data occupies the message body in its native encoding, which is more efficient for high-throughput pipelines where routing decisions can be made on headers alone without deserialising the payload. A third mode, batched content mode, allows multiple CloudEvents to be transmitted in a single protocol frame. Sovereign operations architectures typically favour binary content mode for the core event backbone — because routing and sovereignty checks operate on header attributes alone — while structured content mode is used at ingestion boundaries where events from external sources must be validated in full before admission [6].
In a sovereign operations context, the CloudEvents specification supports an extension mechanism that enables organisations to add domain-specific or governance-specific attributes without violating the standard. Extensions are registered as additional context attributes with defined types and semantics. A sovereign operations programme might define extensions carrying sovereignzone (the zone identifier, type: String), dataclass (the sensitivity classification of the data referenced by the event, type: String, enumerated values drawn from the organisation’s data classification taxonomy), jurisdiction (the regulatory domain applicable to the event, type: String, using ISO 3166-1 country codes or custom zone identifiers), and retentionclass (the retention policy tier applicable to the event, governing how long it may be stored in each zone). These attributes can then be used for routing, filtering and monitoring without requiring downstream consumers to parse event payloads. Because extension attributes are carried in the CloudEvents envelope rather than embedded in the event payload, they are available to every intermediary in the event fabric — brokers, routers, policy engines, monitoring agents — without any dependency on the payload schema. The CNCF maintains a catalogue of community-defined CloudEvents extensions, and several cloud providers now emit CloudEvents-conformant events from their managed services, meaning that the standard can serve as a genuine cross-provider lingua franca for the operational event fabric [6].
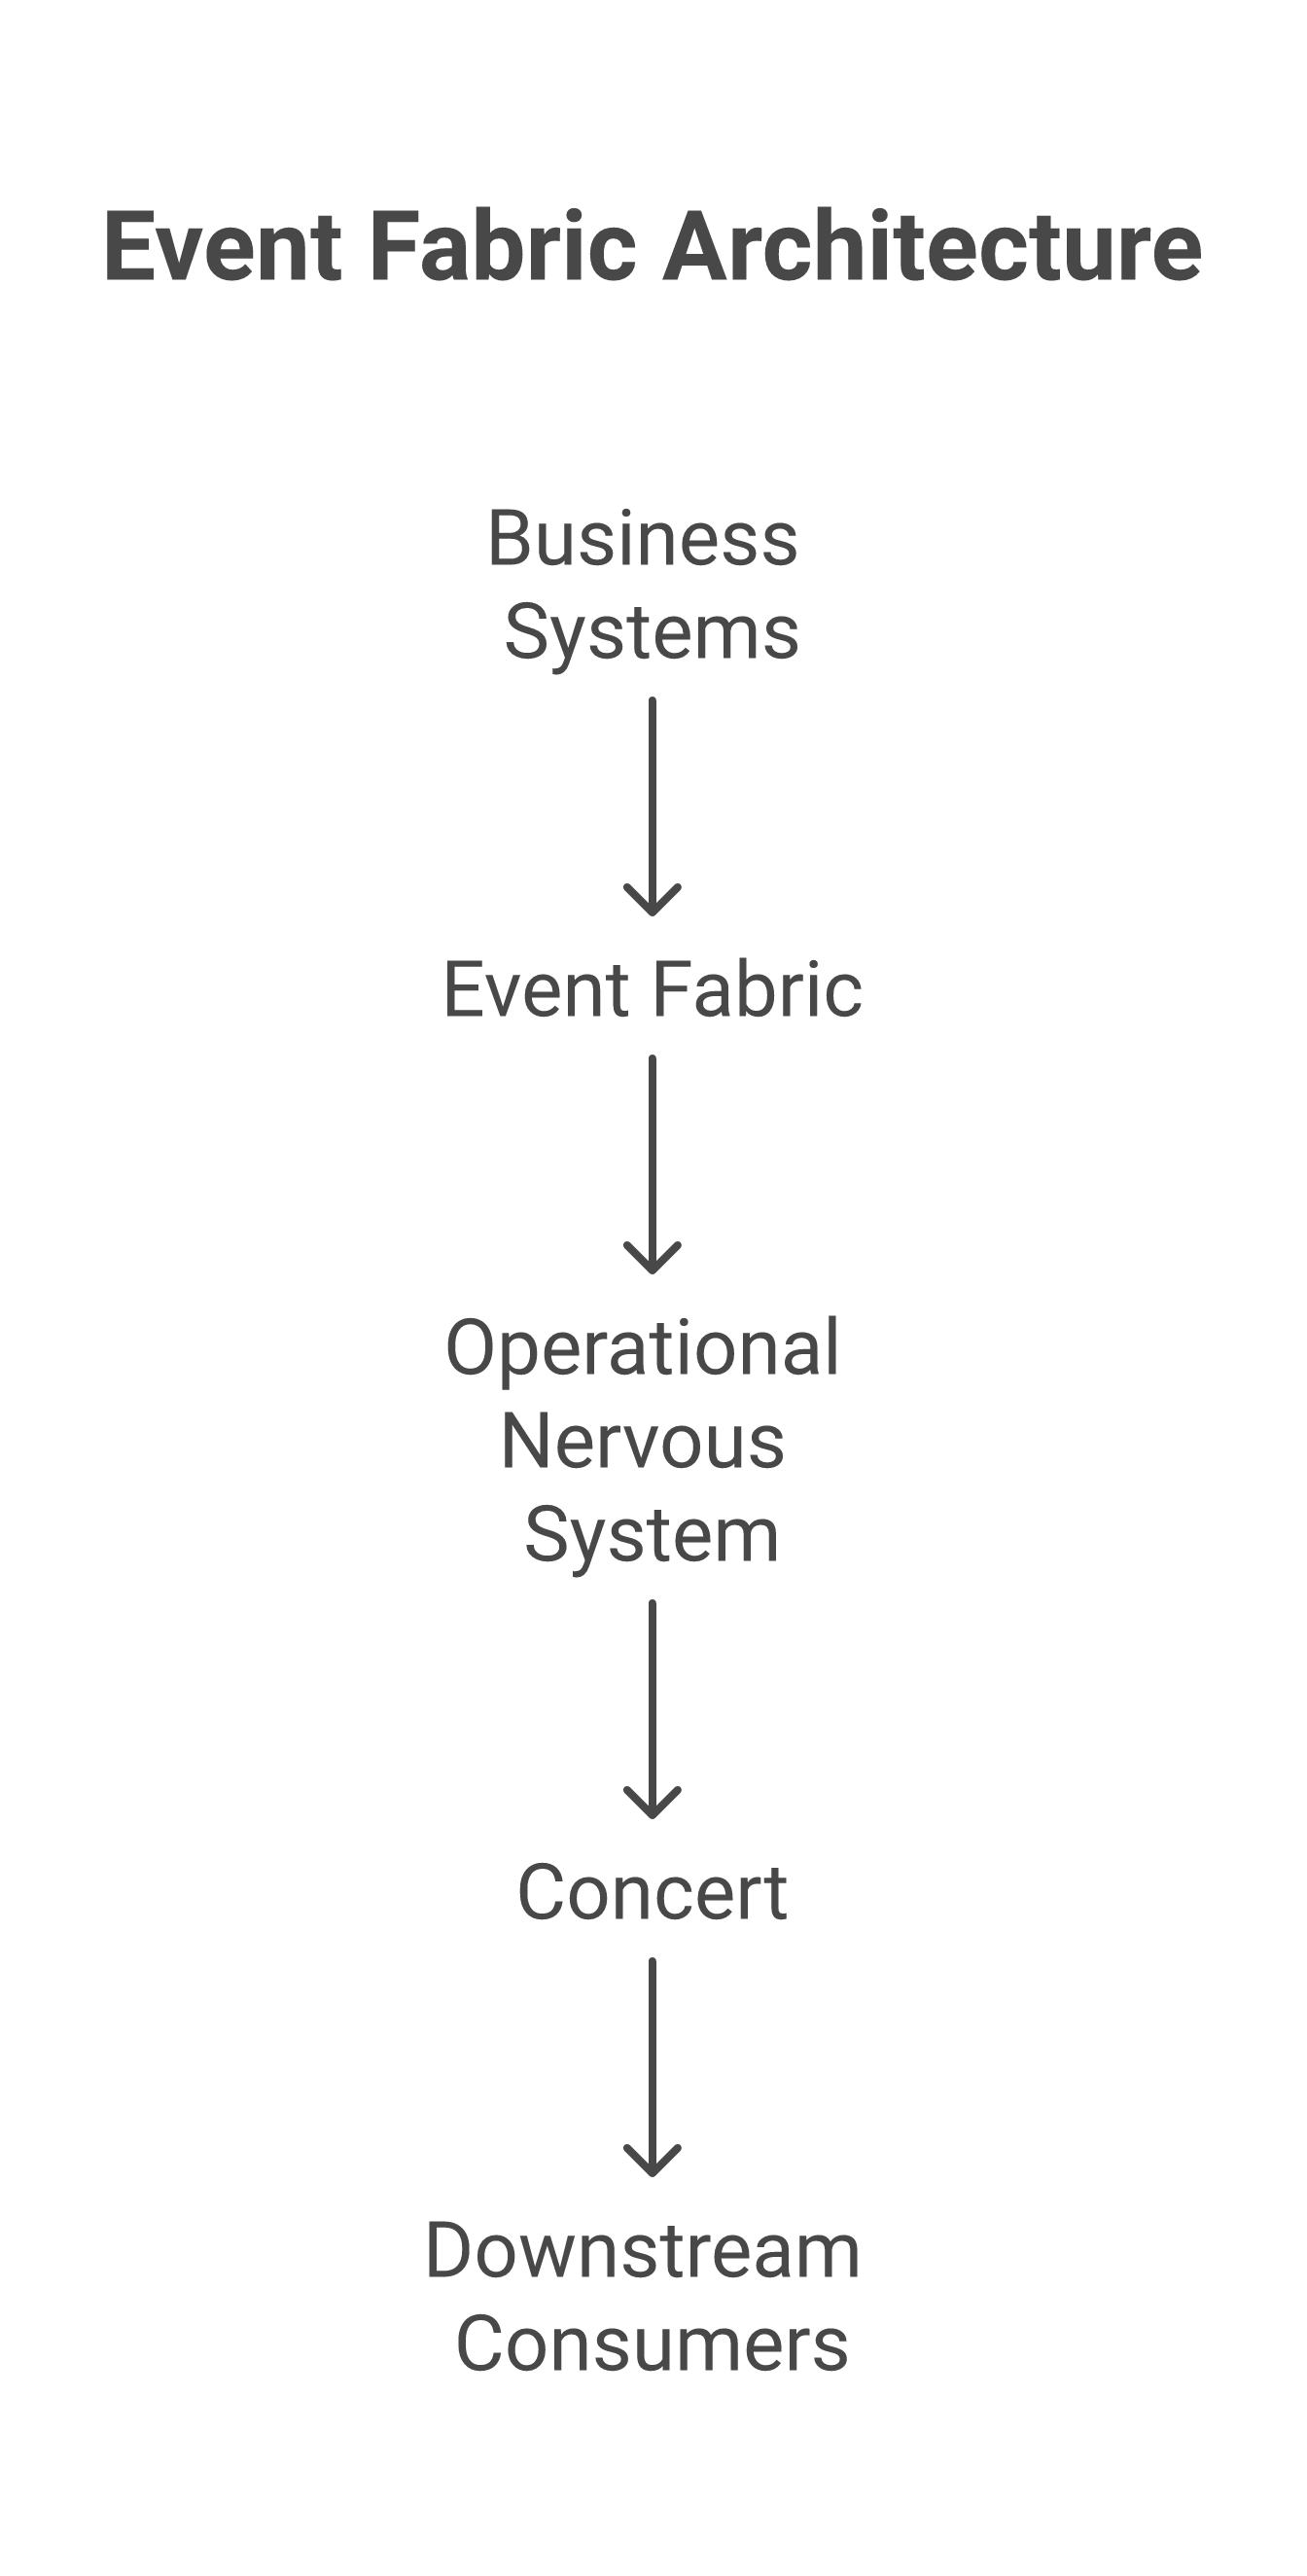
The operational significance of CloudEvents extends to the distinction between business events and infrastructure events flowing through the same fabric. Infrastructure events — a Kubernetes pod being evicted, a cloud provider maintenance notification, a TLS certificate expiry warning — and business events — a payment being authorised, an account being closed, a trade being settled — are often treated as entirely separate streams, monitored by different teams in different tools. In a sovereign operations architecture, there is considerable value in routing both through a common event fabric governed by the CloudEvents standard. When a pod eviction event and a “PaymentFailed” event carry consistent metadata and flow through the same backbone, it becomes possible to construct automated correlations: a cluster of infrastructure events in a particular zone, immediately followed by an increase in business event failures from services in that zone, tells a coherent story that no amount of separate dashboard watching would reveal.
Event enrichment augments raw events with additional context as they flow through the operational fabric. Concert maintains a continuously updated topology graph covering services, applications, deployments, sovereign zones and their interdependencies. As events pass through Concert’s ingestion layer, the producing service is looked up in the topology graph, and its zone membership, criticality classification and dependencies are attached to the event record [7]. This transforms a sparse event — “payment-service emitted PaymentFailed at 14:23:07” — into a rich operational signal: “payment-service (criticality: P1, zone: EU-FS-1, upstream: card-network-adapter, downstream: order-service, ledger-service) emitted PaymentFailed at 14:23:07.” The enriched event can then drive automated triage, SLO burn-rate calculations and incident creation without human intervention.
Event routing in a sovereign context must respect zone boundaries. Content-based routing, in which routing decisions are made on event attributes rather than only topic membership, is the appropriate mechanism. Systems such as Kafka Streams and IBM MQ support conditional forwarding based on header values. When CloudEvents extension attributes carry sovereignty metadata, routing rules can be expressed declaratively — “events with jurisdiction: EU must not be forwarded to consumers outside EU zones” — and enforced by the routing layer without application-level code changes. This creates a sovereignty enforcement point within the event fabric itself, complementing network and storage controls described in Chapters 5 and 6. Section 9.7.1 provides worked examples of sovereign routing in practice.
IBM Event Automation [13] complements Event Streams by providing a higher-level event processing capability that sits above the raw Kafka backbone. Its Event Endpoint Management component allows business and operations teams to discover available event sources through a self-service catalogue, subscribe to specific event streams with fine-grained filtering, and consume curated event feeds without needing direct access to the underlying Kafka topics. Its Event Processing component enables no-code and low-code construction of event processing flows — filtering, transformation, windowed aggregation and pattern detection — that are particularly valuable for the operational event fabric. In a sovereign context, Event Automation’s filtering capabilities provide an additional sovereignty control: cross-zone event consumers can be offered a filtered, redacted view of an event stream that removes or masks fields whose data classification prohibits egress from the originating zone, without requiring the producing application to maintain separate topics for each consumption context.
Consider a typical event-driven e-commerce flow. A user places an order; an “OrderPlaced” event is emitted. Payment, inventory, fraud and shipping services consume that event and emit “PaymentAuthorised,” “InventoryReserved,” “FraudCheckPassed” and “ShipmentCreated” in turn. From an operational perspective, you can watch the rates of these events to detect anomalies — a sudden drop in “PaymentAuthorised” but steady “OrderPlaced” suggests a payment issue — watch the latencies between correlated events — increasing delay from “OrderPlaced” to “InventoryReserved” points at inventory service slowdowns — and watch patterns — a spike in “FraudCheckFailed” from a particular region may indicate an attack or misconfigured rules. Observability guidance for EDAs stresses that metrics, events, logs and traces together — MELT — provide the comprehensive visibility needed for resilient systems [8]. Metrics tell you “how much” and “how fast”; logs and traces tell you “how”; events tell you “what” in business terms.
In a sovereign context, events also help express where. If events carry metadata about sovereign zones, data classes or compliance flags, operators can see not just that failures are occurring, but whether they involve regulated flows. A spike in “DataExportRequested” events tagged with a particular jurisdiction may demand both engineering and compliance attention simultaneously.
The practical implementation of semantic event monitoring requires that operations teams build an event catalogue: a curated inventory of the key business events flowing through the estate, together with their expected rates, acceptable latency ranges, and the downstream consumers that depend on them. This catalogue serves as the authoritative basis for alert configuration, runbook design and SLO definition at the event level. Without it, alert thresholds are set arbitrarily and runbooks are written without reference to the actual business significance of the events they concern. With it, operations teams can define SLOs in business terms — “ninety-nine point nine per cent of OrderPlaced events must result in a PaymentAuthorised event within thirty seconds during trading hours” — and monitor those SLOs with the same rigour applied to infrastructure SLOs. Concert’s service catalogue and dependency mapping capabilities provide the natural home for this event catalogue, since Concert already maintains a topology graph that can be extended to include event stream memberships alongside service and infrastructure relationships [7].
The governance of the event catalogue also has a regulatory dimension. DORA specifies that financial entities must identify and document their critical ICT services and supporting assets [3]. Events flowing through critical ICT processes are logically part of that inventory; documenting them in a machine-readable catalogue linked to Concert’s topology graph creates a continuously maintained evidence base rather than stale spreadsheets updated before each audit cycle.
9.4 Event sourcing and immutable histories
Event sourcing takes the centrality of events one step further. Instead of storing only the latest state of each entity, systems store the entire sequence of events that led to that state. The current state is derived by replaying or projecting these events. Fowler, who articulated this pattern in 2005, describes it as ensuring that all changes to application state are stored as a sequence of events, so that the event log becomes the system of record [5]. This model has profound operational implications.
Because event logs are immutable, they provide a natural audit trail. When something goes wrong, operators can replay events to reproduce the exact progression of state during an incident, analyse the sequence to understand which business rule or service misbehaved, and create alternative projections to understand “what would have happened if…” scenarios. The event log also supports resilience: if a projection or downstream read model is corrupted, it can be rebuilt by replaying events without data loss.
For sovereign operations, event sourcing offers a powerful way to demonstrate control. If regulators ask, “Show us exactly what happened to this customer’s data between these dates,” an event-sourced system can answer precisely: these events, in this order, by these services, in these locations. The GDPR Regulation (EU) 2016/679, in particular, imposes obligations around demonstrating lawful processing and being able to respond to data subject requests, including the right to erasure [9]. Event-sourced systems must address the apparent tension between immutability and erasure obligations — typically through cryptographic erasure of the keys used to encrypt specific event payloads, a pattern known as “crypto-shredding” — but the immutable log remains the most reliable foundation for demonstrating that processing was lawful during the period before an erasure request.
The trade-off is increased storage and conceptual complexity. Operations teams must be comfortable working with event logs as primary sources of truth. Observability must extend to event stores themselves: monitoring append latencies, throughput and error rates; ensuring that replication and durability guarantees are met across sovereign zones; and verifying that retention policies are applied correctly so that event logs do not accumulate without bound in jurisdictions where retention limits apply.
Snapshots are the standard mechanism for managing event sourcing storage costs. Systems periodically serialise the current projected state and replay only events occurring after the most recent snapshot. In a sovereign context, snapshot stores are subject to the same data residency constraints as the event logs they derive from [9]. Event sourcing and CQRS are not prescriptions for every system — they deliver compelling benefits where auditability, temporal queries and event-driven integration are important, but introduce genuine operational complexity. Operations teams should insist on clear ownership of event store observability, explicit runbooks for replay-based recovery, and tested procedures for handling corrupt or duplicate events before such systems reach production at scale.
9.5 Data lineage as an operational tool
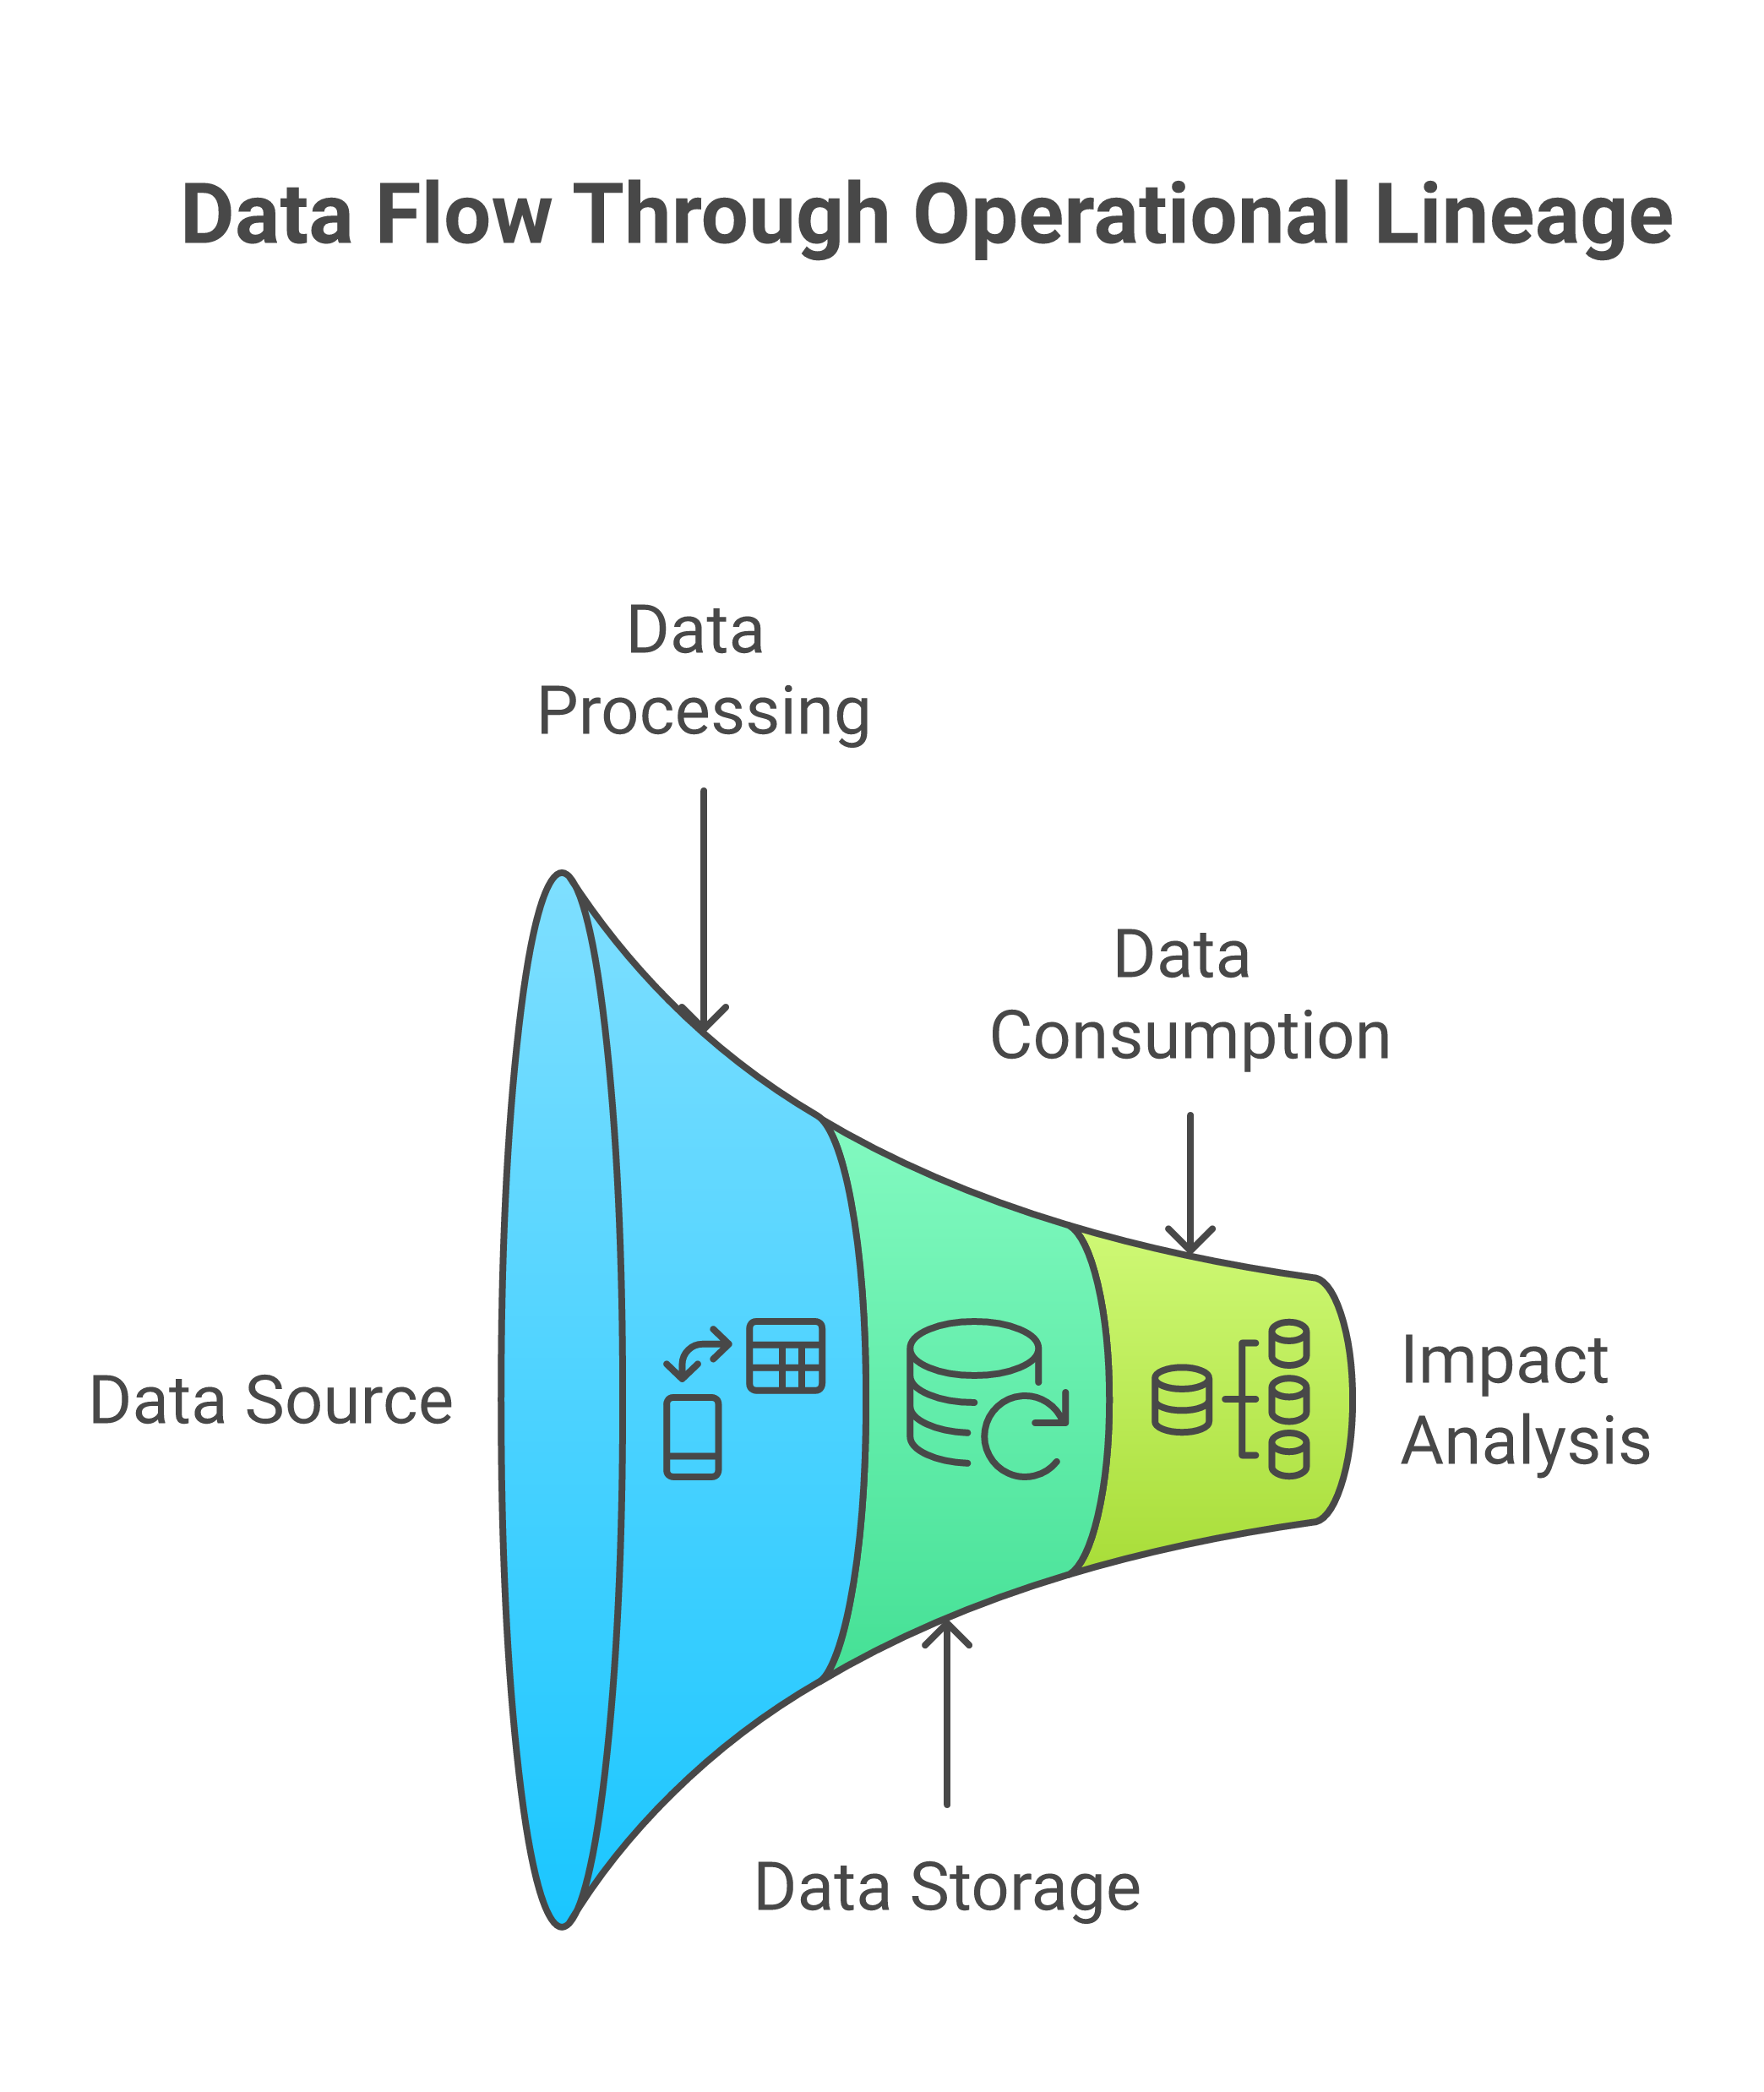
Where events tell you what happened over time, data lineage tells you how data moved and transformed across systems. It answers questions like: which upstream tables and pipelines feed this report? If this field is wrong here, where else might it be wrong? Which flows handle this class of personal data? Traditionally, lineage has lived in the world of data governance and analytics, used to support regulatory reporting, impact analysis for schema changes, and documentation. Increasingly, however, practitioners argue that lineage is essential for incident response and operations [10].
The OpenLineage specification, currently a Linux Foundation project, provides a vendor-neutral, open standard for collecting and representing lineage metadata from data pipelines, SQL queries, Spark jobs, dbt transformations and other data processing workloads [2]. Its central data model is the RunEvent: a structured JSON document emitted at the start, completion or failure of a processing job, recording the job’s inputs (datasets consumed), outputs (datasets produced), run metadata (start time, end time, duration, exit status), and facets — extensible metadata blocks that can carry custom attributes such as schema snapshots, data quality assertions, or sovereignty tags. The RunEvent is emitted by a producer (a Spark application, an Airflow task, a dbt model run) using one of the official OpenLineage clients available for Python, Java and other languages, and is received by a compatible backend — such as Marquez, the reference implementation, or a commercial metadata platform — that stores and indexes the lineage graph. Because the RunEvent schema is open and versioned, it can be extended without breaking existing consumers, and multiple orchestration systems can emit compatible events into the same lineage backend [2].
The Apache Atlas metadata and governance framework provides a complementary capability: a persistent, queryable metadata graph in which entities (tables, columns, pipelines, processes, users) and their relationships are stored and indexed [11]. Where OpenLineage is a streaming protocol for lineage events, Atlas is optimised for persistent browse-and-query access to the accumulated graph. The two complement each other naturally: OpenLineage RunEvents are ingested into Atlas (or Atlas-compatible platforms) to build up a persistent lineage graph. Atlas supports fine-grained classification of entities and propagates classifications along lineage edges, so that a classification applied to a source table automatically propagates to all derived tables and reports [11].
It is important to distinguish operational lineage from data governance lineage. Governance lineage answers questions about data ownership, quality policy and regulatory classification on timescales of hours or days. Operational lineage captures which pipelines ran, which datasets they consumed, and what their execution status was, on timescales of seconds to minutes. A mature sovereign operations architecture treats lineage as a shared asset serving both audiences, with appropriate access controls governing who can query which parts of the graph.
Lineage during incidents is where operational lineage delivers its most compelling return on investment. When a data quality alert fires — say, a downstream risk report is showing anomalous values — the incident commander’s first question is: “What feeds this report, and has anything changed upstream?” Without lineage, answering this question requires manual investigation: scanning Git history for recent pipeline changes, querying logs for failed jobs, interviewing data engineers. With lineage, Concert can query the lineage graph programmatically, traversing the upstream edges from the affected dataset to enumerate all contributing pipelines, identify which ran successfully and which did not in the relevant time window, and surface the most likely source of the defect [7]. This transforms a question that might take an experienced data engineer several hours into an automated query that returns results in seconds. Some observability platforms report that integrating lineage into incident workflows reduces mean time to resolution for data incidents by thirty to fifty per cent, primarily by eliminating the manual traversal of upstream dependencies [10].
The sovereignty dimension of lineage is of particular significance. A well-instrumented lineage graph records not only what data flowed where, but also which zone it traversed and which processing environment handled it. When OpenLineage RunEvents are emitted with sovereign zone metadata in their facets, the lineage graph becomes an auditable record of data’s jurisdictional journey. Regulators can query: “Did any EU-resident personal data cross a zone boundary during this window?” or “Which pipelines processed DORA-reportable data during this incident?” These questions become first-class queries against the lineage graph rather than forensic reconstruction exercises. Concert incorporates these queries into incident investigation playbooks, surfacing sovereignty violations as structured findings [7].
The GDPR imposes specific obligations around records of processing activities, requiring demonstration that personal data is processed only for specified purposes in lawful jurisdictions [9]. An operational lineage graph provides evidence that directly satisfies these obligations — not as a manually maintained document, but as a machine-generated, continuously updated record derived from actual system behaviour.
Modern lineage platforms combine metadata from databases, ETL tools, query logs and streaming systems to build an always-up-to-date map of flows. Automated lineage mapping enables pre-deployment impact analysis as a standard gate in CI/CD pipelines, and when integrated with data observability platforms it helps distinguish critical incidents from local glitches by revealing whether a problem affects a high-impact downstream asset. Regulators increasingly expect organisations to know, and be able to show, where regulated data flows and how it is transformed [3] [9]. For operations, lineage diagrams are not static documentation; they are interactive tools for understanding and managing the blast radius of changes and incidents.
9.5.1 Lineage query patterns for operations
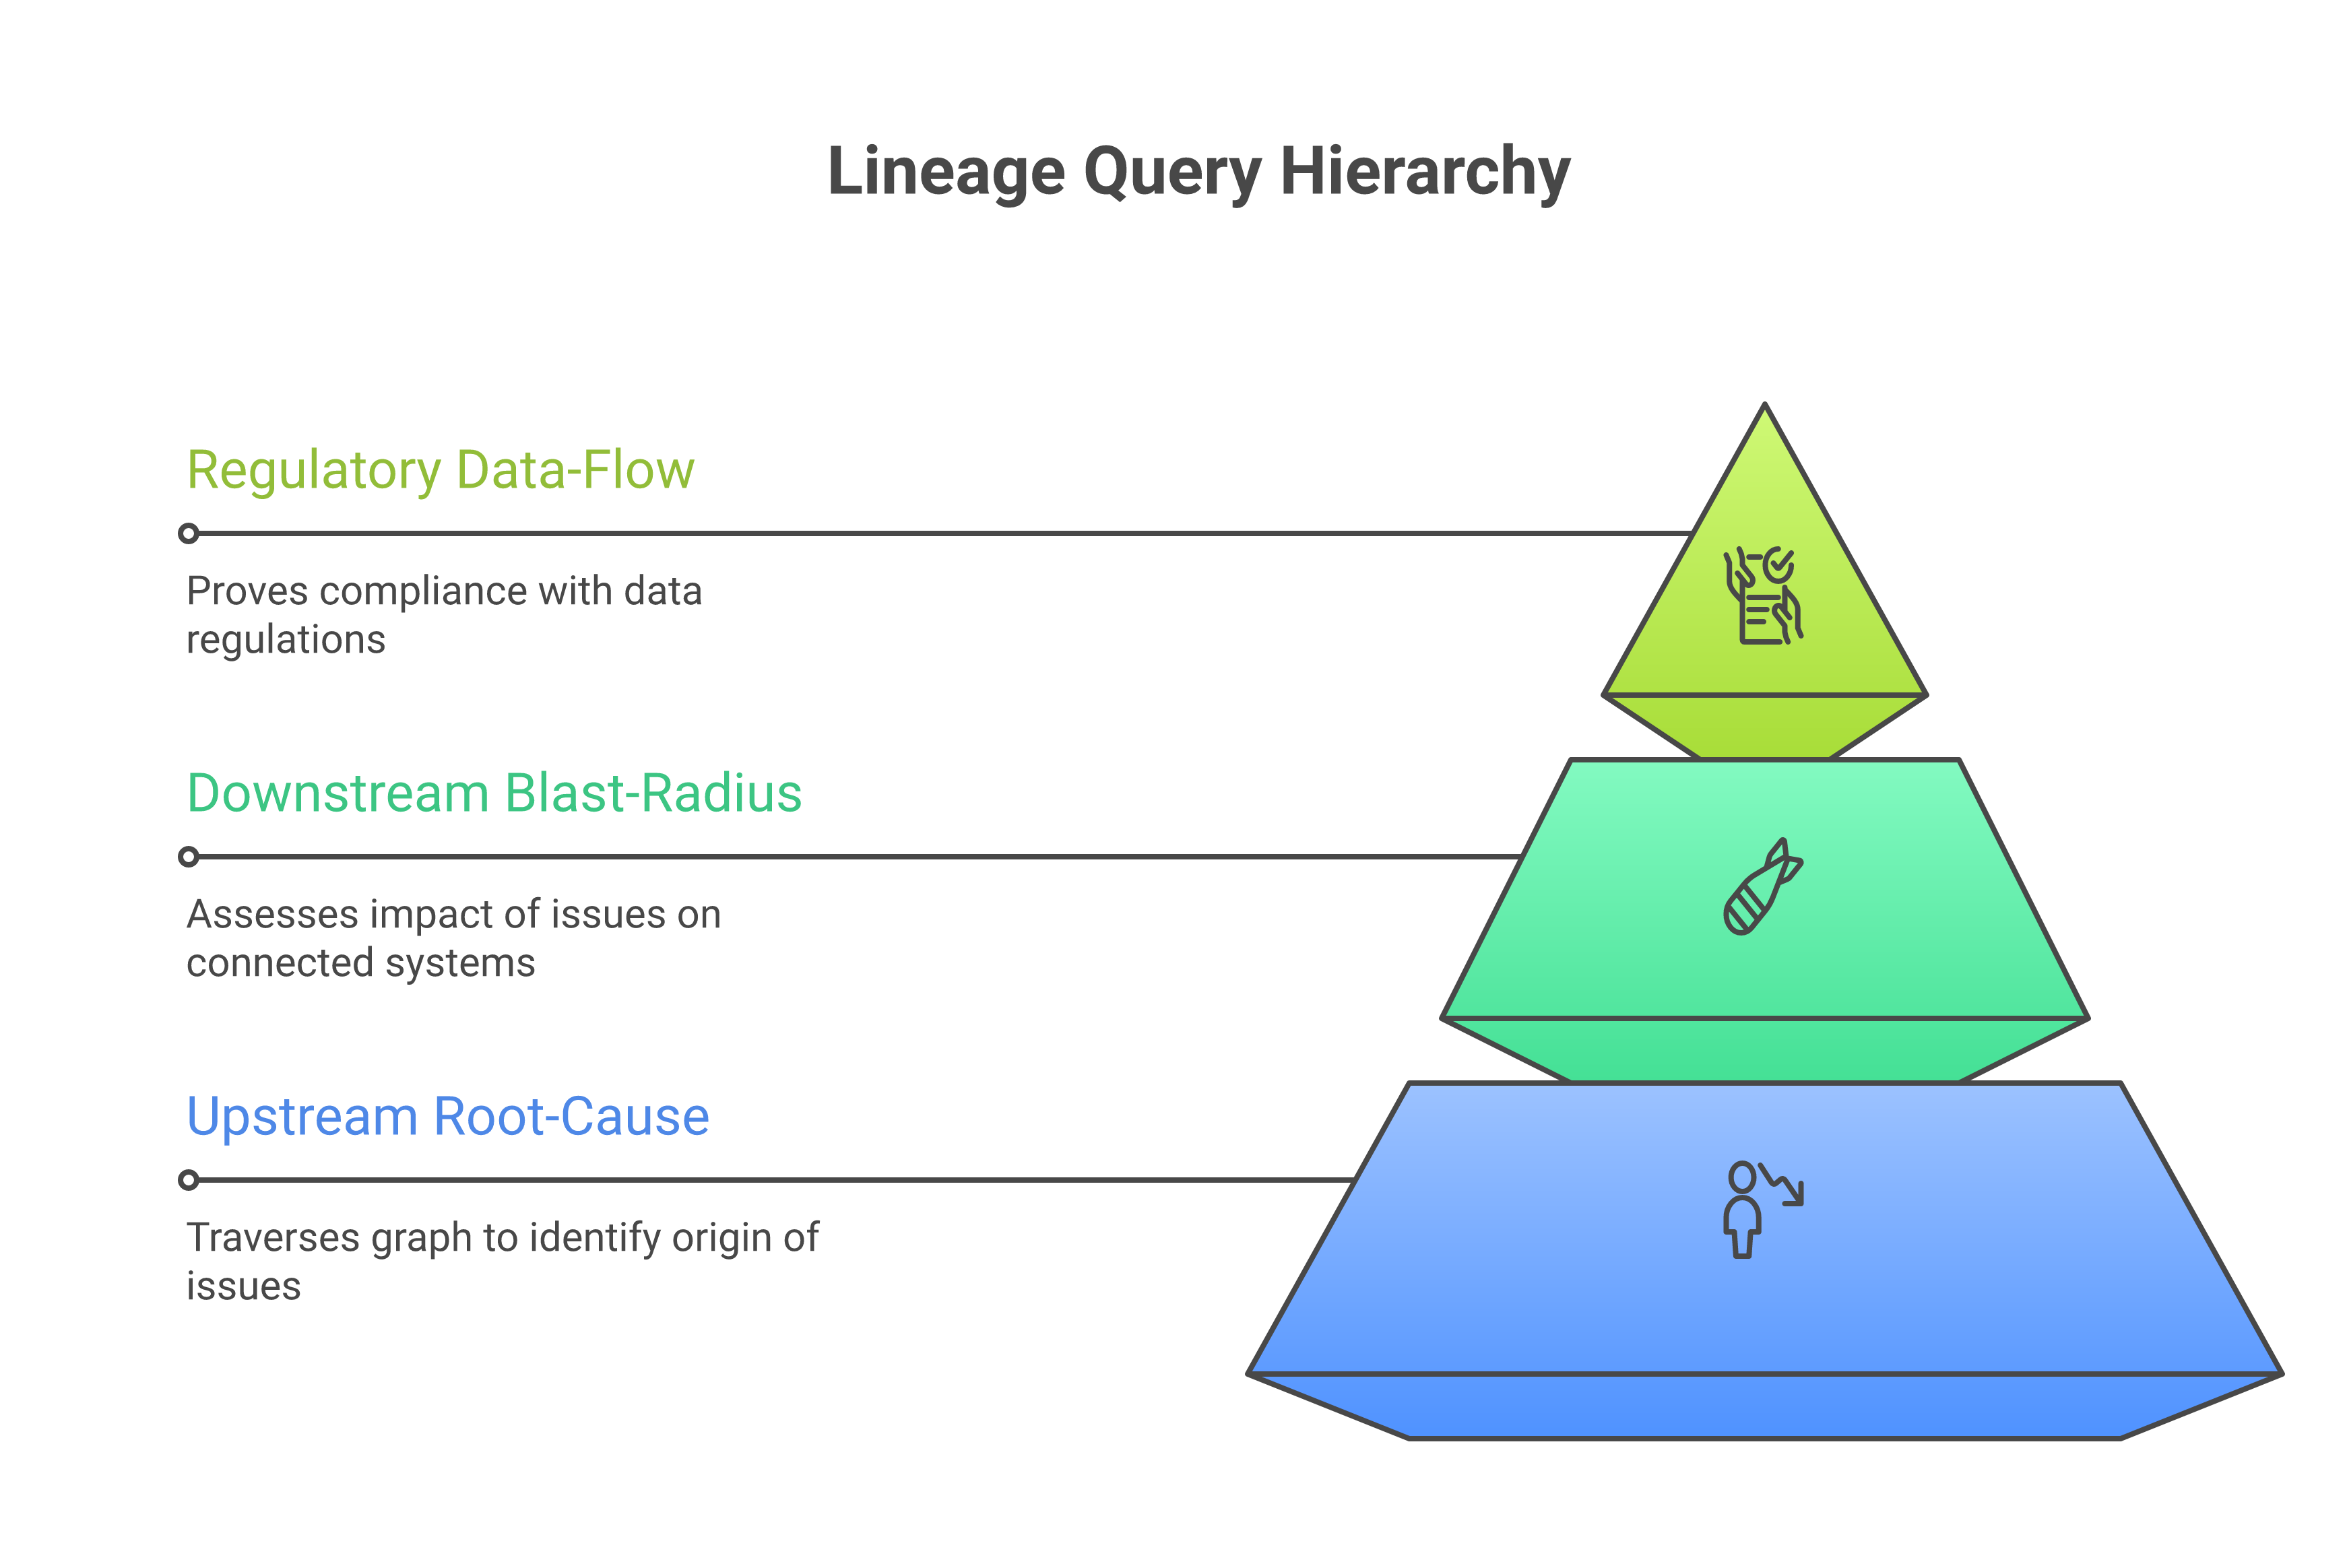
The operational value of a lineage graph is realised through queries. Three query patterns recur across incident response, change management and regulatory compliance, and operations teams should be fluent in all three.
Upstream impact analysis — “What feeds this asset, and has anything changed?” — is the most common lineage query during incidents. When a downstream report or dashboard displays anomalous values, the incident commander needs to traverse the lineage graph backwards from the affected dataset to enumerate every contributing pipeline, source table and event stream. In Apache Atlas, this is accomplished through the REST API’s lineage endpoint: a GET request to /api/atlas/v2/lineage/{guid} with direction=INPUT and a configurable depth parameter returns the subgraph of all upstream entities and the process nodes connecting them [11]. The Marquez API, the reference implementation for OpenLineage, exposes a similar capability through its /api/v1/lineage endpoint, which returns the directed graph of jobs and datasets upstream and downstream of a given node, annotated with the most recent run status and execution times [2]. In either case, the query result is a structured graph that Concert can consume programmatically, filtering for nodes whose most recent run failed, whose execution duration exceeded a threshold, or whose zone metadata indicates a potential sovereignty violation.
Downstream blast-radius assessment — “If this source changes or fails, what is affected?” — is the inverse query and is critical for change management. Before a schema migration, a database failover or a deliberate source decommission, operations and platform teams need to know which downstream assets — reports, ML training pipelines, regulatory submissions, customer-facing APIs — depend on the asset being changed. The same Atlas and Marquez lineage endpoints serve this purpose with direction=OUTPUT. In a sovereign operations context, blast-radius queries are augmented with a zone filter: the query not only enumerates affected downstream assets but classifies them by the sovereign zone in which they operate, enabling the change advisory board to assess both technical and jurisdictional impact in a single review. Concert can automate this assessment as part of its change-risk evaluation workflow, querying the lineage graph when a change request is raised and attaching the blast-radius report to the change ticket before human review begins [7].
Regulatory data-flow proof — “Show me every path by which personal data classified as EU-resident reaches this analytics environment” — is the query that regulators and auditors increasingly expect organisations to be able to answer on demand. This query traverses the lineage graph forward from source datasets tagged with a specific data classification (using Atlas’s classification propagation model) and filters for paths that cross zone boundaries or terminate in environments outside the permitted jurisdictions. The result is a machine-generated evidence artefact that documents the actual data flows, as observed from system behaviour, rather than a manually maintained data flow diagram that may have drifted from reality. When OpenLineage RunEvents include sovereign zone facets and Atlas classifications propagate along lineage edges, this query becomes a standard graph traversal rather than a forensic reconstruction exercise [2] [11].
9.6 Data observability meets lineage and events
Data observability and lineage are increasingly viewed as complementary capabilities. Observability monitors data health — freshness, volume, schema changes, distribution anomalies — while lineage provides the context needed to understand and act on those signals [10].
When a data observability platform detects an anomaly — a sudden drop in transaction counts or a schema change in a stream — it can use lineage to identify the upstream source that likely caused the issue, enumerate affected downstream consumers, and alert the right owners with context. The reverse is equally valuable: when lineage records show a pipeline failure, observability monitors can be queried automatically to determine whether downstream datasets have begun to degrade. This bidirectional integration creates a feedback loop faster and more precise than either discipline achieves alone.
Column-level lineage improves observability outcomes by allowing precise tracing down to specific fields [10]. Apache Atlas models individual columns as entities with their own lineage edges, so a change in a source column’s data type propagates as a traceable event through all downstream transformations referencing that column, enabling impact analysis scoped precisely rather than conservatively at the table level [11].
In an operational context, integrating data observability with lineage and events yields a powerful triad. Events tell you that something happened — in business terms. Data observability tells you that something is wrong with data quality or behaviour. Lineage tells you where to look and who will feel the impact. These three dimensions are rarely sufficient in isolation: an anomalous event rate without lineage context does not tell you which downstream reports are at risk; a lineage graph without observability data does not tell you whether the data flowing through those pipelines is actually correct; data observability alerts without event context do not tell you which business transactions are affected. The triad is the minimum viable observability stack for a data-intensive, event-driven estate.
Agentic operations can exploit this triad. An agent responding to a data incident can combine alerts from observability with lineage maps to propose targeted remediation steps: roll back a specific change, pause a particular pipeline, regenerate a projection from the event log, or notify a defined group of consumers. Concert’s agentic workflows are designed to consume all three signal types, enabling automated incident analysis that spans the business event layer, the data observability layer and the lineage graph simultaneously [7]. The practical value of this integration is most apparent during major incidents involving multiple concurrent failures: rather than dispatching separate teams to investigate infrastructure, data quality and business impact independently and then reconciling their findings in a war room, Concert can correlate signals across all three dimensions within seconds of an incident being declared, presenting the incident commander with a structured hypothesis about root cause, blast radius and recommended remediation actions.
9.6.1 Concert’s ingestion of event and lineage signals
Concert’s topology model — the continuously maintained graph of services, applications, infrastructure resources and their dependencies — serves as the correlation backbone for event and lineage signals.
Concert consumes event signals through two paths. First, it ingests Kafka consumer group metrics via a Prometheus-compatible endpoint or direct JMX integration. Consumer group lag, partition offset positions, rebalance events and broker-level throughput metrics flow into Concert’s time-series store, associated with topology nodes representing Kafka clusters, topics and consumer services. Second, Concert ingests CloudEvents-conformant business and infrastructure events through a webhook receiver or a dedicated Kafka consumer subscribing to the organisation’s operational event topics. As each event arrives, Concert’s enrichment pipeline resolves the source attribute to a topology node, attaches the node’s zone membership, criticality tier and dependency context, and indexes the enriched event for correlation. This dual-path ingestion gives Concert a view spanning both the mechanical health of the event fabric and the business significance of what flows through it [7].
For lineage signals, Concert integrates with OpenLineage-compatible backends — Marquez, Atlas or commercial metadata platforms — through their REST APIs. When an incident is declared or a change request is raised, Concert queries the lineage backend for the upstream and downstream graph of the affected assets, as described in section 9.5.1. The query results are merged into Concert’s topology graph for the duration of the investigation, creating a transient, enriched view that overlays lineage paths onto the service and infrastructure topology. This overlay enables Concert to answer compound questions that neither graph could answer alone: “Which sovereign zone hosts the pipeline that most recently wrote to the dataset feeding the degraded report, and is that pipeline’s Kafka consumer group currently lagging?” The ability to pose and answer such questions programmatically is what distinguishes an integrated operational platform from a collection of individual observability tools [7].
9.7 Events and lineage in sovereign operations
Sovereign operations care not only about correctness and performance, but also about where and under what authority data moves. Events and lineage are natural instruments for making this visible.
Events can be enriched with sovereignty metadata: which jurisdiction or sovereign zone they originate in, what sensitivity level they pertain to, which regulatory regimes apply. In data mesh and event-streaming architectures, domains often treat data as a product and expose it via streams with well-defined contracts and governance. Those contracts can include sovereignty attributes enforced at the event fabric layer, as described in section 9.3. A domain that publishes a “CustomerProfileUpdated” event stream, for example, can declare in the stream’s contract that events in this stream contain personal data subject to GDPR, that they must not be forwarded to consumers outside EU sovereign zones, and that any processing of the events must be logged to the lineage graph with zone metadata. These declarations are machine-readable and can be enforced automatically by the event fabric’s routing layer, rather than relying on each consumer team to implement their own compliance controls independently.
Lineage, in turn, can show which paths sensitive data takes across zones and providers, whether any flows cross boundaries they should not, and which services or domains are responsible for moving or transforming regulated data. When combined, events and lineage support proactive sovereignty monitoring. If events tagged with a particular jurisdiction begin flowing into a region that is not permitted, this can trigger an incident automatically. If lineage shows that a new pipeline would route regulated data through a non-compliant path, an agent or policy engine can block deployment before it happens.
9.7.1 Sovereign routing worked examples
Three concrete scenarios illustrate how event routing works within and across sovereign zones when policy constraints are in force.
Scenario one: intra-zone routing with data classification filtering. A retail bank operates two Kafka clusters within its EU sovereign zone — one for general operational events and one reserved for events classified as PII. The fraud-detection service subscribes to both; a marketing-analytics service, operated by a third-party processor whose agreement permits only aggregated data, subscribes to the general cluster only. When the payments service emits a “TransactionCompleted” event, the routing layer inspects the CloudEvents dataclass extension attribute. If the value is PII, the event is forwarded only to the PII cluster. The fraud-detection service receives it; the marketing-analytics service does not. No application-level code change is required: the routing decision is made entirely on envelope attributes and the declarative policy maintained by the platform team.
Scenario two: cross-zone event forwarding with payload redaction. A multinational insurer operates sovereign zones in the EU and Singapore. Claims events originating in Singapore must reach an actuarial modelling service in the EU zone, but Singapore’s Personal Data Protection Act restricts transfer of personal data. The event fabric addresses this through a redaction gateway at the zone egress point: when a “ClaimSubmitted” event with jurisdiction: SG is forwarded to the EU zone, the gateway strips personal data fields (policyholder name, national identification number, contact details), replacing them with pseudonymised tokens. The redacted event retains its business semantics — claim type, amount, date, policy identifier — while the personal data remains within the Singapore zone. The OpenLineage RunEvent emitted by the redaction gateway documents the transformation and zone crossing for regulatory audit.
Scenario three: policy-blocked cross-zone routing. A European energy utility operates a sovereign zone in Germany subject to critical infrastructure regulations (KRITIS). A newly deployed analytics pipeline in the utility’s US-hosted cloud attempts to subscribe to a Kafka topic carrying smart-meter telemetry tagged with sovereignzone: DE-KRITIS and dataclass: critical-infrastructure. The event fabric’s policy engine evaluates the subscription against the zone’s egress policy, which prohibits forwarding critical-infrastructure data outside the EU. The subscription is denied; the policy engine emits a sovereignty violation event to Concert, which creates an incident ticket, notifies the platform security team, and logs the attempted violation as a compliance finding.
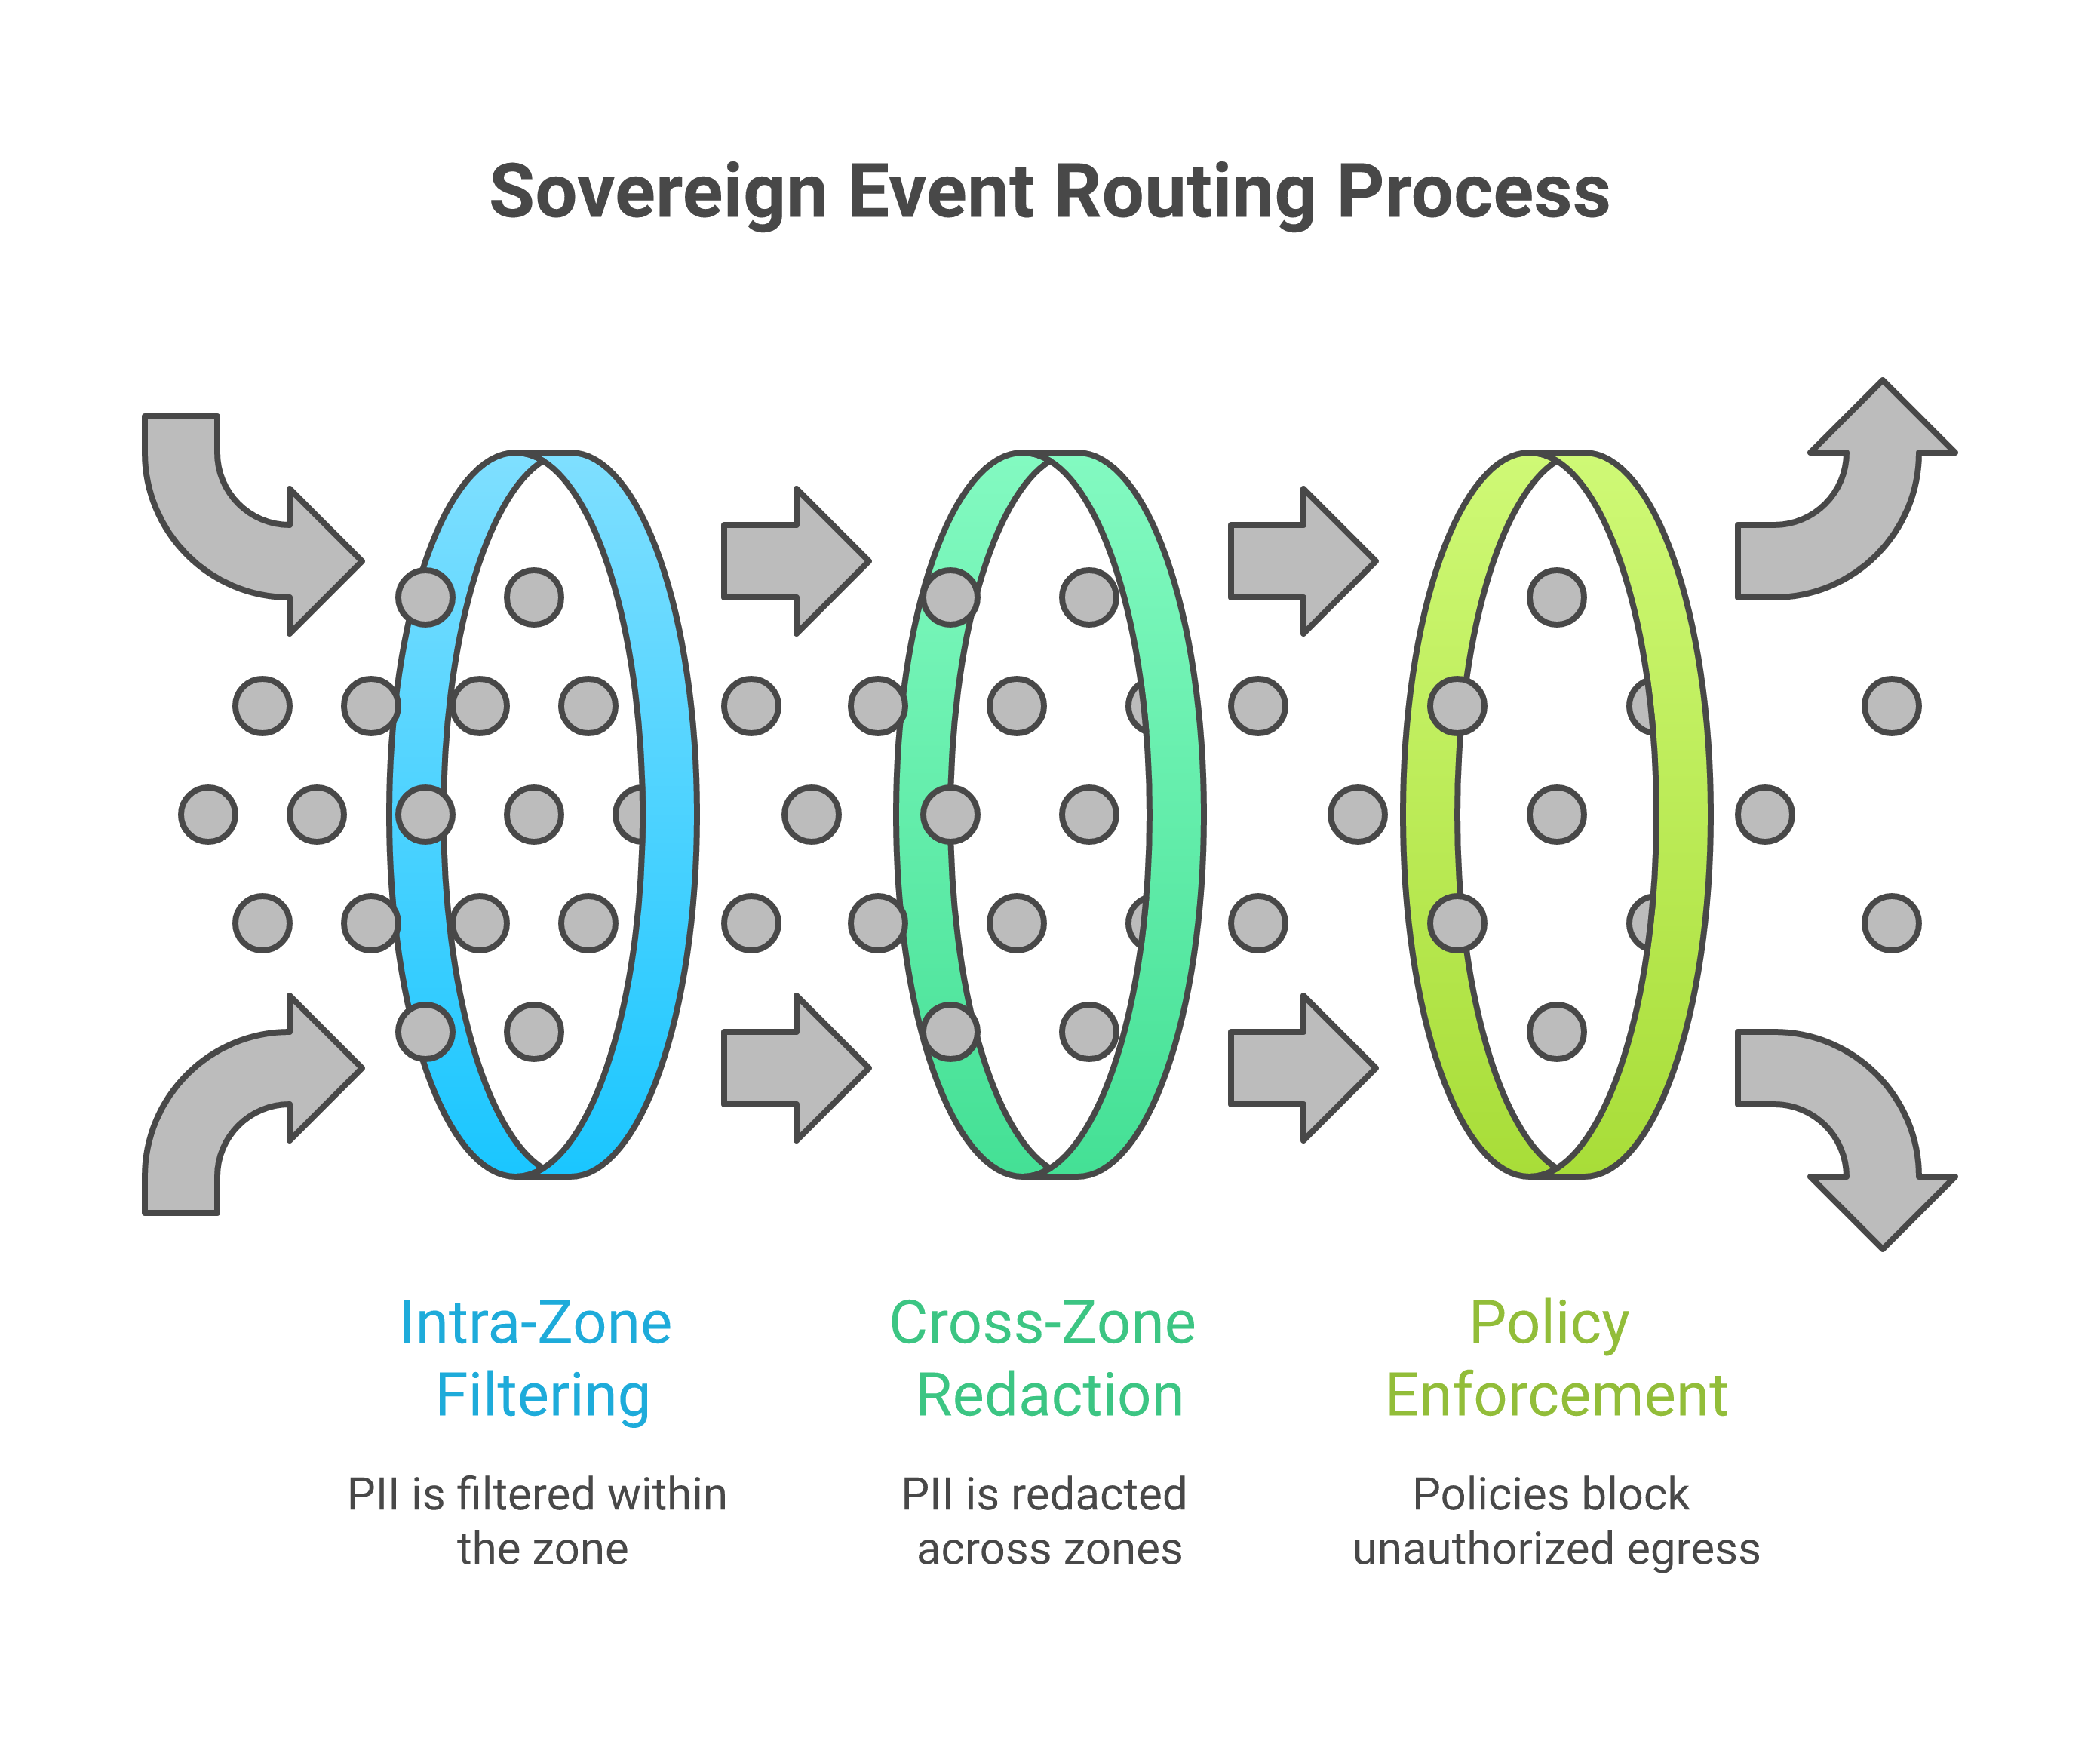
The combination of CloudEvents sovereignty extensions, OpenLineage zone facets, and Atlas propagated classifications creates a layered, self-documenting sovereignty record: the event fabric records what flowed where in near real time; the lineage graph records how data was transformed and through which zones it passed; and the Atlas metadata graph records the classifications and ownership assignments that governed those flows at the time they occurred. Together, they provide the evidentiary foundation for demonstrating sovereign control to regulators, auditors and board-level risk committees.
For regulatory evidence, event logs and lineage graphs turn sovereignty from a conceptual assertion into a traceable, auditable reality. DORA requires financial entities to classify incidents by impact on critical functions and report to competent authorities within specific timeframes [3]; the ability to query the event log and lineage graph for a precise chronology — which systems, which zones, which times — transforms forensic reconstruction into a near-automated reporting process [3] [9].
9.8 Making events and lineage part of the operations muscle memory
Turning events and lineage into operational assets is not mainly a tooling problem; it is a practice problem.
Teams need to expose events to operators — not just to developers and data engineers, but to SREs, incident commanders and risk teams. Operational consoles should include event-centric views: rates, latencies and anomalies for key business events. Lineage must be integrated into incident workflows: when an incident is declared, one of the standard questions should be “What does lineage say about upstream causes and downstream impact?” Incident playbooks and agent workflows should call lineage APIs as routinely as they query logs. Where event sourcing is used, teams should practise replay-based debugging and recovery as a regularly tested operational capability, not a theoretical exercise.
Culturally, operators should think in terms of flows over time, not just static states. The Apache Atlas metadata browser provides interactive lineage visualisation navigable by non-specialist users [11], and Concert’s operational dashboard surfaces event-driven signals alongside traditional metrics [7]. Training, runbook design and incident retrospective practice should treat event and lineage fluency as a core operational skill. As sovereign, zero-copy, event-driven architectures mature, the organisations that succeed will be those that bring events and lineage into their muscle memory of operations.
Key Takeaways
- Event-driven architectures introduce four distinct patterns — event notification, event-carried state transfer, event sourcing and CQRS — each with specific operational implications that require tailored observability strategies rather than a single unified approach.
- Consumer group lag is the leading operational indicator in Kafka-based EDAs, surfacing capacity and connectivity problems before they produce visible errors or business-metric degradation, and should be monitored as a first-class signal alongside CPU and latency.
- The CloudEvents specification v1.0 provides a vendor-neutral, extensible metadata standard for events; its binary, structured and batched content modes and its extension mechanism for sovereignty attributes enable cross-system correlation and content-based routing without payload inspection.
- Schema governance across sovereign zones requires a two-gate model: structural compatibility checks via the Schema Registry and sovereignty policy checks via OPA, ensuring that schema changes introducing regulated fields are evaluated against the zones in which consumers operate before promotion.
- The OpenLineage RunEvent schema and Apache Atlas metadata graph together provide operational lineage as a machine-readable, queryable asset; three lineage query patterns — upstream root-cause traversal, downstream blast-radius assessment and regulatory data-flow proof — should be embedded in incident and change-management workflows.
- Sovereign event routing must enforce zone boundaries through content-based routing on CloudEvents envelope attributes, with redaction gateways for cross-zone forwarding and policy-blocked egress for prohibited data classes.
- Concert integrates event and lineage signals through dual-path ingestion — Kafka infrastructure metrics and CloudEvents business events — and overlays lineage graph queries onto its topology model during incidents, enabling compound cross-domain correlation.
- Making events and lineage operational requires practice as much as tooling: teams must embed event-centric views into normal operational consoles, lineage queries into standard incident playbooks, and replay-based recovery into regularly exercised operational procedures.
Bridge to Chapter 10 — Continuous Compliance
This chapter has established that events and lineage are not peripheral concerns in sovereign cloud operations — they are foundational. Events, when standardised through CloudEvents and enriched with topology context, become semantic operational signals that make the behaviour of distributed systems legible to both engineering and risk audiences. Schema governance, enforced through a two-gate model of structural compatibility and sovereignty policy checks, prevents schema evolution from introducing regulatory violations. Lineage, when captured through OpenLineage and persisted in Atlas-compatible metadata graphs, becomes a real-time operational tool for three core query patterns: upstream root-cause traversal, downstream blast-radius assessment and regulatory data-flow proof. Sovereign routing — from intra-zone PII filtering through cross-zone redaction gateways to policy-blocked egress — ensures that the event fabric itself enforces jurisdictional constraints. Consumer group lag, schema registry health and partition replication state complete the operational picture for the Kafka-based event fabrics that underpin most large-scale EDAs. Concert integrates these signals through dual-path ingestion and lineage graph overlay, enabling automated incident investigation that spans business events, data quality and jurisdictional compliance in a single coherent view.
The logical next step is to ask how this rich signal fabric supports the continuous, automated assessment of compliance posture. Chapter 10 addresses that question directly. It examines how policy-as-code frameworks consume events, lineage records and observability signals to produce a continuously evaluated compliance state — one that can be interrogated in near real time rather than reconstructed retrospectively at audit time. It also explores how Concert’s governance workflows close the loop between detection and evidence, ensuring that every deviation from policy is not only detected but recorded, attributed and resolved in a manner that satisfies the evidential standards of DORA, GDPR and the broader sovereign regulatory landscape.
References
[1] M. Kleppmann, Designing Data-Intensive Applications: The Big Ideas Behind Reliable, Scalable, and Maintainable Systems. Sebastopol, CA: O’Reilly Media, 2017.
[2] OpenLineage Project, “OpenLineage Specification,” Linux Foundation, 2021. [Online]. Available: https://openlineage.io/spec
[3] European Parliament and Council of the European Union, “Regulation (EU) 2022/2554 of the European Parliament and of the Council of 14 December 2022 on digital operational resilience for the financial sector (DORA),” Official Journal of the European Union, vol. L 333, pp. 1–79, Dec. 2022. [Online]. Available: https://eur-lex.europa.eu/legal-content/EN/TXT/?uri=CELEX:32022R2554
[4] Apache Software Foundation, “Apache Kafka Documentation,” Apache Software Foundation, 2024. [Online]. Available: https://kafka.apache.org/documentation/
[5] M. Fowler, “Event Sourcing,” martinfowler.com, Dec. 2005. [Online]. Available: https://martinfowler.com/eaaDev/EventSourcing.html
[6] Cloud Native Computing Foundation, “CloudEvents Specification v1.0.2,” CNCF, 2022. [Online]. Available: https://github.com/cloudevents/spec/blob/v1.0.2/cloudevents/spec.md
[7] IBM Corporation, “IBM Concert Documentation,” IBM, 2024. [Online]. Available: https://www.ibm.com/docs/en/concert
[8] New Relic, “Why Observability Matters for Event-Driven Architecture,” New Relic Blog, 2023. [Online]. Available: https://newrelic.com/blog/infrastructure-monitoring/why-observability-matters-for-event-driven-architecture
[9] European Parliament and Council of the European Union, “Regulation (EU) 2016/679 of the European Parliament and of the Council of 27 April 2016 on the protection of natural persons with regard to the processing of personal data (GDPR),” Official Journal of the European Union, vol. L 119, pp. 1–88, May 2016. [Online]. Available: https://eur-lex.europa.eu/legal-content/EN/TXT/?uri=CELEX:32016R0679
[10] Monte Carlo Data, “AI Data Lineage,” Monte Carlo Data Blog, 2024. [Online]. Available: https://www.montecarlodata.com/blog-ai-data-lineage/
[11] Apache Software Foundation, “Apache Atlas Documentation,” Apache Software Foundation, 2024. [Online]. Available: https://atlas.apache.org/
[12] Confluent, Inc., “Schema Registry Overview,” Confluent Documentation, 2024. [Online]. Available: https://docs.confluent.io/platform/current/schema-registry/index.html
[13] IBM Corporation, “IBM Event Automation: Event Endpoint Management and Event Processing,” IBM Documentation, Armonk, NY, USA, 2024. [Online]. Available: https://www.ibm.com/products/event-automation
Sovereign Cloud Operations: AI-Driven Management of Sovereign Estates
© 2026 by Alan Hamilton
is licensed under CC BY-SA 4.0


