Chapter 14 — IBM Concert: Architecture of the Operational Brain
Summary
This chapter presents the architecture of IBM Concert as the operational brain of a sovereign, multi-cloud estate. It explains how Concert continuously discovers and maintains a typed entity graph of services, deployments, infrastructure components and their dependencies, then ingests metrics, logs, traces, change events and business signals to correlate them against that live topology model. The chapter details Concert’s correlation engine, its causal inference approach combining graph-based reasoning with historical pattern matching, and its health scoring and recommendation generation system that converts raw signals into prioritised, evidence-backed guidance for operators and agents. Architects will also find coverage of Concert’s sovereign zone awareness, its collector and integration architecture, the governance controls that constrain recommendations within zone boundaries, and the federated deployment patterns required for estates spanning multiple jurisdictions.
14.1 Concert as the operational brain
Every large organisation running software across multiple clouds and multiple jurisdictions faces the same underlying problem: the estate is too large, too dynamic, and too interconnected for any human team to hold in its head. Engineers know their own services well; they know their immediate dependencies reasonably well; beyond that, the picture becomes hazy. When something goes wrong—and in complex distributed systems something always eventually goes wrong—the critical questions are rarely answered quickly. Which business services are affected? What is the probable cause? What should be done first? Who should be told? Traditional operations tooling answers none of these questions well, because it was not designed to.
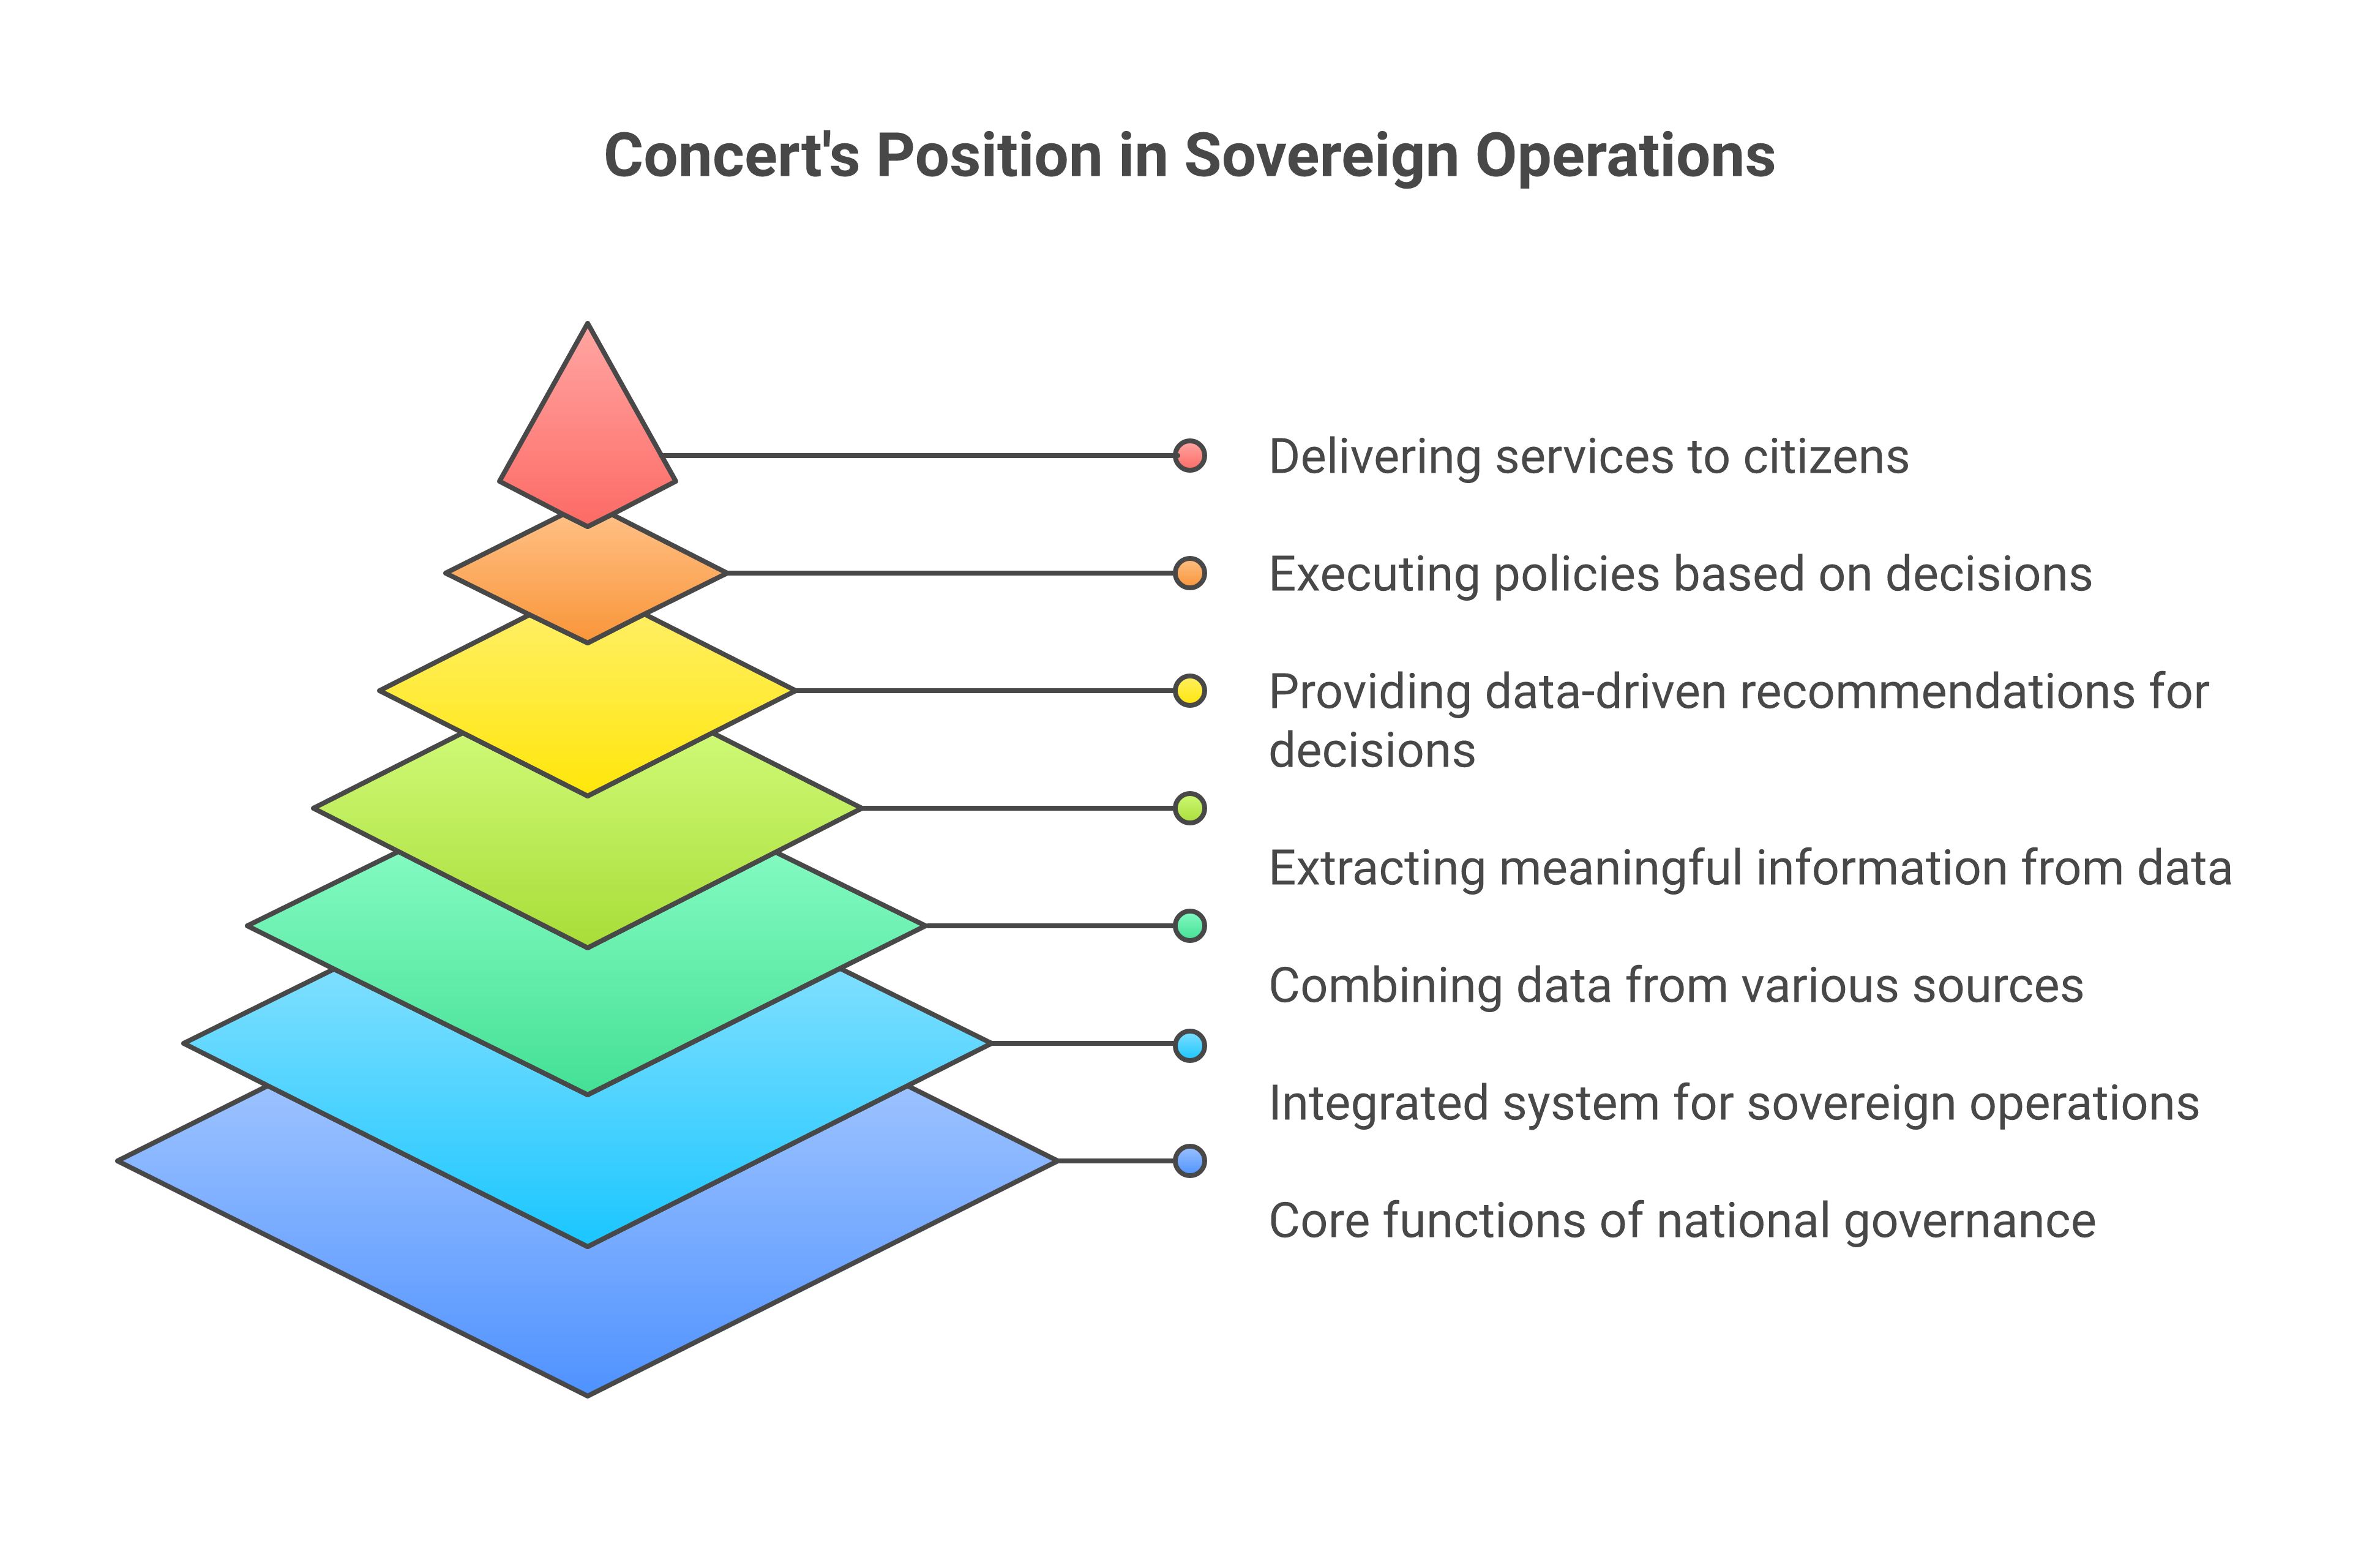
IBM Concert is designed to answer precisely those questions. It is not a monitoring tool in the conventional sense. It does not simply collect metrics, display dashboards, and fire alerts when thresholds are crossed. Nor is it an ITSM platform, a runbook executor, or a capacity planning tool, though it touches all of those concerns. Concert is, in the terminology of this book, the operational brain of the sovereign, multi-cloud estate: the system that continuously maintains an accurate model of what exists and how it relates, ingests signals from across the operational surface, correlates those signals into meaningful situations, and generates prioritised, evidence-backed recommendations that tell operators—and, where bounded autonomy permits, automated agents—what deserves attention and what to do about it [1].
The distinction from traditional AIOps tools is important enough to state directly. Most AIOps platforms of the prior generation addressed the symptom of alert overload by applying machine learning to streams of alerts—grouping related alerts, suppressing duplicates, scoring by historical frequency. This is useful, but it operates at the surface of the problem. It treats alerts as the primary unit of analysis without understanding the underlying structure of the estate that produced them. Concert’s architecture inverts this priority. The primary unit of analysis is the entity—a service, a deployment, an infrastructure component, a dependent API—and its relationships to other entities. Alerts, metrics, logs, and events are signals that describe the state of entities, not ends in themselves. When Concert groups signals into a situation and generates a recommendation, it is reasoning about the dependency graph of the estate, not merely clustering alert strings. Gartner’s Market Guide for AIOps Platforms [2] notes the evolution of the category towards topology-aware, causal reasoning capabilities; Concert represents the operational implementation of that direction within the IBM sovereign stack.
What Concert is not also deserves clarity. It is not an observability platform; Instana plays that role, providing the instrumented, topology-enriched signal collection from which Concert draws much of its input. It is not a workflow execution engine; watsonx Orchestrate executes the recommendations that Concert generates. It is not a configuration management database in the traditional sense, though it builds and maintains an entity model that subsumes CMDB information. Concert’s value is in the reasoning layer: the continuous correlation of signals against a live topology model to produce actionable, prioritised intelligence. Everything that happens before Concert—instrumentation, collection, storage—feeds into it. Everything that happens after—workflow execution, remediation, audit—builds on its recommendations.
14.2 Topology discovery and the estate model
Concert’s usefulness depends entirely on the accuracy and currency of its model of the estate. A recommendation engine that reasons over a stale or incomplete topology model will produce recommendations that are locally plausible but globally wrong—proposing to restart a service without recognising that three other services are hard-dependent on it, or attributing a problem to a database it believes is standalone when in fact it is a shared dependency for six applications. The first concern in Concert’s architecture is therefore not signal ingestion or correlation but topology discovery: continuously building and maintaining a structured, accurate model of what exists and how it relates [1].
14.2.1 Discovery sources
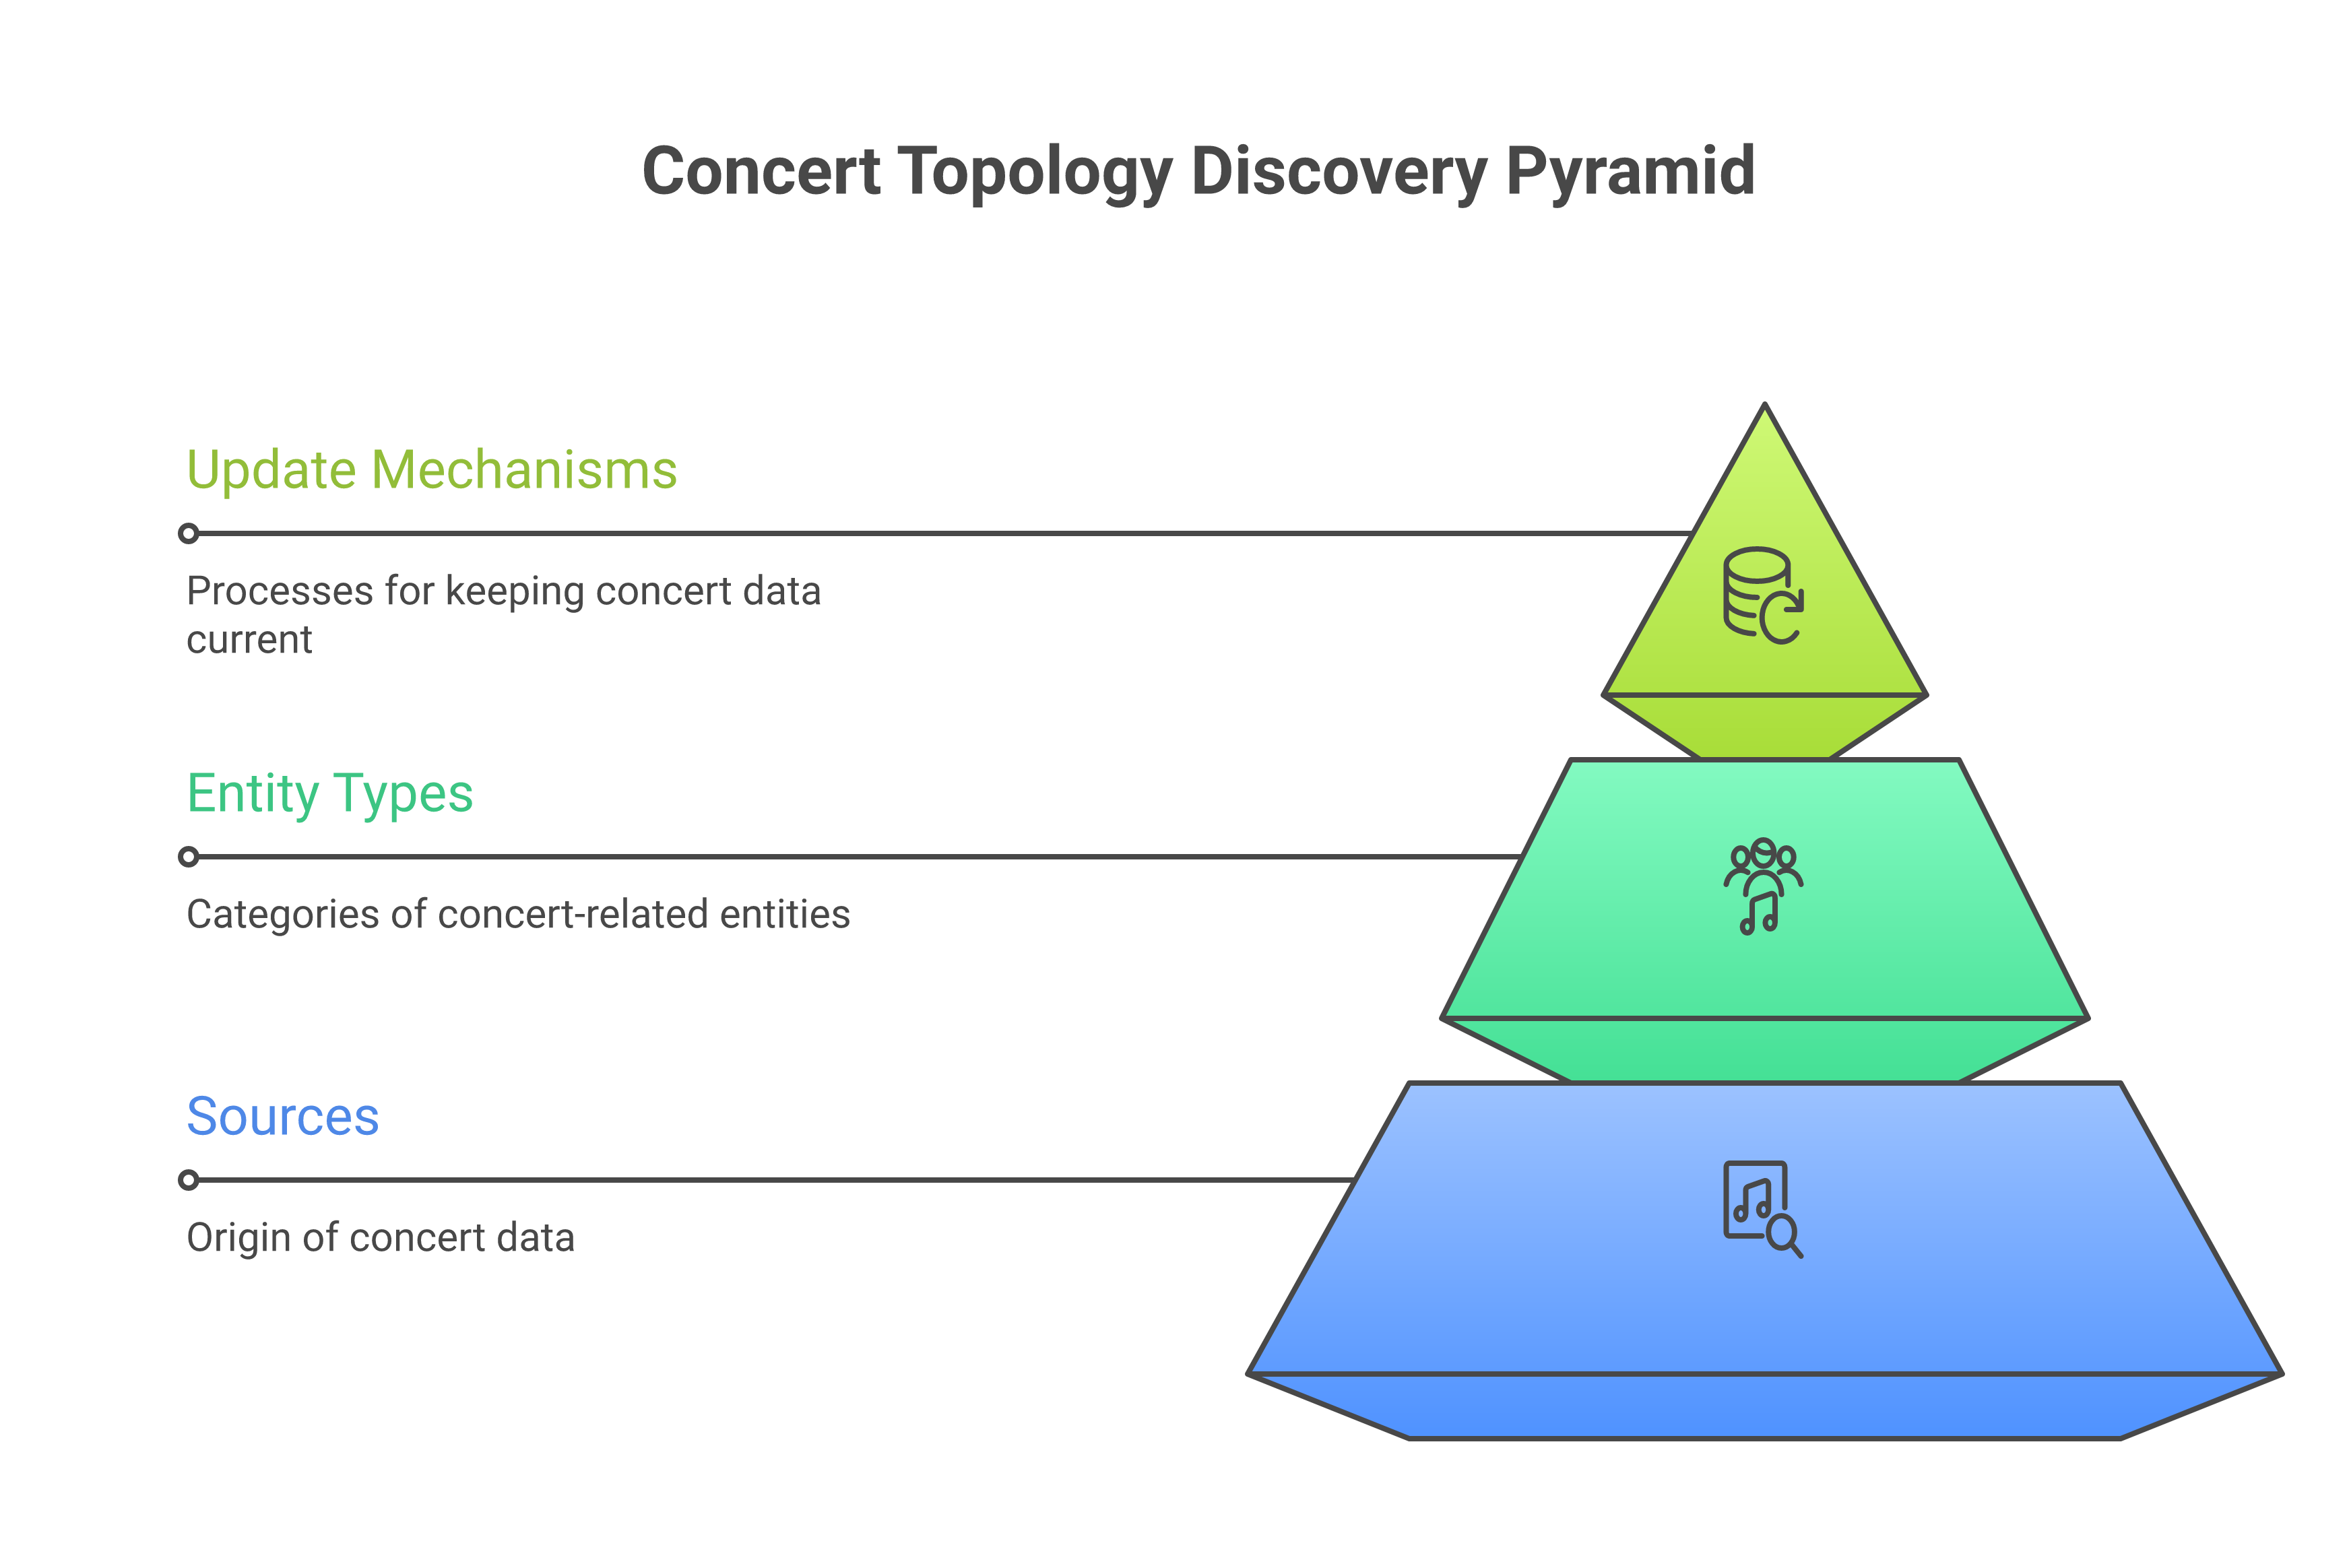
Concert discovers topology from multiple classes of source, and the completeness of the resulting model depends on the breadth of discovery configured for a given estate.
Kubernetes API servers are the primary discovery source for containerised workloads. Concert queries the Kubernetes API to enumerate namespaces, deployments, services, pods, configmaps, persistent volumes, ingress rules, and service accounts. It follows owner references and label selectors to reconstruct the logical grouping of these resources into applications and services. In OpenShift environments, additional resource types—routes, image streams, build configurations—are discovered via the OpenShift API extensions. The discovery is continuous: Concert watches Kubernetes event streams rather than relying solely on periodic polling, which means that newly deployed services, scaled deployments, and configuration changes are reflected in the entity model within seconds of occurring in the cluster [1].
Cloud provider APIs extend discovery beyond the cluster boundary. For AWS deployments, Concert queries the EC2 API for instances and auto-scaling groups, the EKS API for managed cluster state, RDS for database instances, ElastiCache for caching layers, Route 53 for DNS configuration, and IAM for service account relationships. For Azure, the Azure Resource Manager API provides discovery of virtual machines, AKS clusters, Azure SQL, Cosmos DB, and virtual network configurations. For GCP, the Cloud Resource Manager and Kubernetes Engine APIs serve equivalent purposes. IBM Cloud contributes IBM Kubernetes Service and Red Hat OpenShift on IBM Cloud cluster state, IBM Cloud Object Storage bucket configurations, IBM Db2 on Cloud instances, and IBM Cloud Satellite location registrations. The collector agents responsible for each cloud provider’s discovery are discussed in detail in section 14.6 [1].
Configuration management databases provide a different class of information: the human-maintained record of which applications own which infrastructure, what service level agreements apply to which services, and how components are classified by criticality and data sensitivity. Concert integrates with ServiceNow and other ITSM platforms via their CMDB APIs, drawing in service ownership, change freeze windows, and business service criticality classifications that cannot be inferred from infrastructure APIs alone. This integration is particularly important for the priority scoring described in section 14.4: a Concert recommendation gains precision when it knows not just that a database is experiencing latency but that the affected database underpins a business service classified as critical under the organisation’s ITSM taxonomy.
Observability platforms complete the discovery picture with the dependency relationships that emerge from runtime behaviour rather than from declared configuration. Instana’s automatic topology discovery—derived from its deep instrumentation of running processes, network connections, and distributed traces—provides Concert with service dependency maps that reflect actual call patterns [3]. A service may declare no dependency on a particular database in any configuration file, but if Instana observes it making database connections, that dependency is real and belongs in Concert’s entity model. This runtime-observed topology is often more accurate than declared topology in fast-moving estates where documentation lags deployment.
14.2.2 The Concert entity model
The entities that Concert discovers and maintains are organised into a typed graph model. The primary entity types are services, deployments, infrastructure components, dependent APIs (including third-party and SaaS endpoints), and sovereign zone assignments. Each entity carries a set of attributes: the entity type and identifier, its owning team or business service, its criticality classification, its sovereign zone membership, and the timestamps of its most recent discovery and update. Relationships between entities are typed edges in the graph: a service depends-on another service, a deployment is-an-instance-of a service, an infrastructure component hosts a deployment, a service calls an external API [1].
The sovereign zone assignment is a first-class attribute in Concert’s entity model, not an afterthought. Every entity discovered in a zone-aware deployment is tagged with its zone identifier at the point of discovery, using the zone labels applied to the underlying Kubernetes clusters, cloud accounts, or network segments from which it was discovered. This tagging enables Concert to answer zone-aware questions—which services in the regulated EU zone have upstream dependencies on components outside that zone?—and to generate zone-constrained recommendations—remediation actions proposed for a sovereign zone should not require changes to components in a different zone. The governance implications of zone-aware entity modelling are discussed further in sections 14.7 and 14.8.
14.2.3 Keeping the model current
A topology model that was accurate at discovery time and then left static is almost immediately wrong in a dynamic cloud estate. Services are deployed and decommissioned. Scaling events add and remove instances. Configuration changes alter dependency relationships. Concert addresses the currency problem through a combination of three mechanisms.
Event-driven updates provide the fastest path to model currency. Concert subscribes to Kubernetes event streams, cloud provider event buses (AWS EventBridge, Azure Event Grid, GCP Pub/Sub), and ITSM change management event feeds. When a relevant event is received—a new pod scheduled, a deployment updated, a change record closed—Concert applies the corresponding update to the entity model without waiting for the next scheduled reconciliation cycle. For most topology changes in active clusters, the entity model reflects the new state within a few seconds [1].
Periodic reconciliation provides a correctness guarantee that event-driven updates alone cannot provide. Events can be lost; subscriptions can have gaps; cloud provider event delivery is at-most-once in some configurations. Concert runs scheduled full-reconciliation passes against each discovery source, comparing the current entity model against the state returned by the source API and applying corrections where discrepancies exist. The reconciliation interval is configurable by discovery source type; for Kubernetes clusters it is typically short, on the order of minutes; for CMDB systems where change rates are lower it may be longer.
Drift detection complements reconciliation by identifying conditions where the entity model records a state that the discovery source no longer confirms. Drift may indicate a legitimate change that preceded the next reconciliation, or it may indicate a problem: a service that should be present is not responding to the API, a sovereign zone label has been removed from a cluster without a corresponding change record. Concert surfaces detected drift as a signal in its own right, associable with entities and includable in situation correlation [1].
14.2.4 The dependency graph for impact analysis
The dependency graph that Concert maintains is the foundation of its impact analysis capability. When Concert receives a signal indicating that a particular component is degraded—a database reporting elevated query latency, a service returning elevated error rates—it traverses the dependency graph to identify which other entities are likely affected. The traversal follows the depends-on edges in the graph in both directions: downstream from the affected component to identify which services will experience degraded upstream dependencies, and upstream to identify what the affected component itself depends on, which may suggest the root cause.
The graph traversal for impact analysis uses edge weights that reflect the nature and strength of each dependency. A service that calls another service on every request has a strong synchronous dependency; a service that calls another only for background reconciliation has a weaker, more tolerant dependency. Concert derives these weights from the runtime call frequency and latency distributions observed by Instana, creating an impact model that distinguishes between hard dependencies that will immediately degrade a service and soft dependencies whose degradation has a delayed or partial effect [1].
This weighted impact analysis is what allows Concert to produce a business impact estimate for each situation it identifies—not merely a list of affected components but a calculation of which business services are likely experiencing degraded quality, and by how much, based on the chain of dependencies from the affected component to the services that ultimately deliver business value.
14.3 Signal ingestion and correlation
Topology discovery gives Concert the skeleton of the estate model. Signal ingestion clothes that skeleton with live operational state. Concert ingests a broad set of signal types, each carrying different information about what is happening in the estate, and its correlation engine works across all of them to assemble a coherent picture of current operational conditions [1].
14.3.1 Signal types
Metrics represent the quantitative health of entities over time. Concert ingests metrics from Instana—the primary source of application and infrastructure performance data in the IBM sovereign stack—and from Prometheus and compatible exporters operating in environments where Instana’s full instrumentation is not deployed. Importantly, Concert’s ingestion architecture is not limited to IBM-originated signals. Organisations running Datadog, Splunk, Elastic, Dynatrace or other third-party observability platforms can feed metrics into Concert through OpenTelemetry-compatible pipelines or through Concert’s REST-based signal ingestion API. Concert’s correlation engine operates over the entity-tagged signal data it receives regardless of the originating tool; its value is in topology-aware reasoning, not in proprietary data capture. This openness is architecturally significant: it means that Concert can serve as the correlation and intelligence layer across a heterogeneous observability estate, enabling organisations to adopt Concert without displacing their existing monitoring investments (see also Chapter 4, section 4.9). Relevant metrics include request rates, error rates, latency distributions, saturation indicators (CPU, memory, connection pool exhaustion), and custom application metrics exposed by service teams. Concert does not store raw metric time series in its own backend; it queries Instana or the source TSDB at correlation time and caches the relevant slices for reasoning [3].
Logs contribute event-level detail that metrics cannot provide. Concert does not ingest raw log streams; doing so would replicate the function of Instana and centralised logging backends and impose impractical data volumes. Instead, Concert ingests structured log-derived signals: anomaly scores computed by Instana’s log analytics, extracted error patterns, and log-based event triggers configured by operators to fire when specific patterns are observed. The result is that Concert receives a semantically meaningful summary of log state rather than raw log data, which keeps its correlation engine focused on signal rather than noise [1].
Traces provide the request-level causal chain that is essential for diagnosing latency problems in distributed systems. The OpenTelemetry specification [4] defines the trace data model—spans, parent-child relationships, baggage—that Concert uses to associate trace-level observations with specific service entities in its dependency graph. When Concert identifies elevated latency in a service, trace data allows it to identify which specific operation or downstream call is the source of the latency increase, rather than leaving the diagnosis at the service boundary. Concert ingests trace summaries from Instana’s trace backend, keyed by service entity identifiers.
Change events are a signal type that distinguishes Concert’s architecture from monitoring tools that observe only operational telemetry. Concert ingests change events from CI/CD pipelines (deployments completing, image updates pushed), GitOps systems (ArgoCD sync events, Flux reconciliation results), ITSM platforms (change records opened, approved, and closed), and cloud provider change logs (IAM policy modifications, network security group updates, database parameter changes). The temporal correlation of change events with operational signal changes is one of Concert’s most powerful diagnostic capabilities: a service latency increase that began within two minutes of a new deployment is a fundamentally different situation from one that began during a period of no changes, and Concert’s correlation engine treats them differently [1].
Business events complete the signal vocabulary. Concert ingests SLA breach notifications, transaction failure rate alerts from business monitoring platforms, and financial threshold events from connected business intelligence systems. These signals are important because they allow Concert to connect operational conditions to business consequences—a recommendation scored against business impact is more actionable than one scored against technical severity alone. Business event ingestion is configurable and depends on the event sources available in each organisation’s environment.
14.3.2 The correlation engine
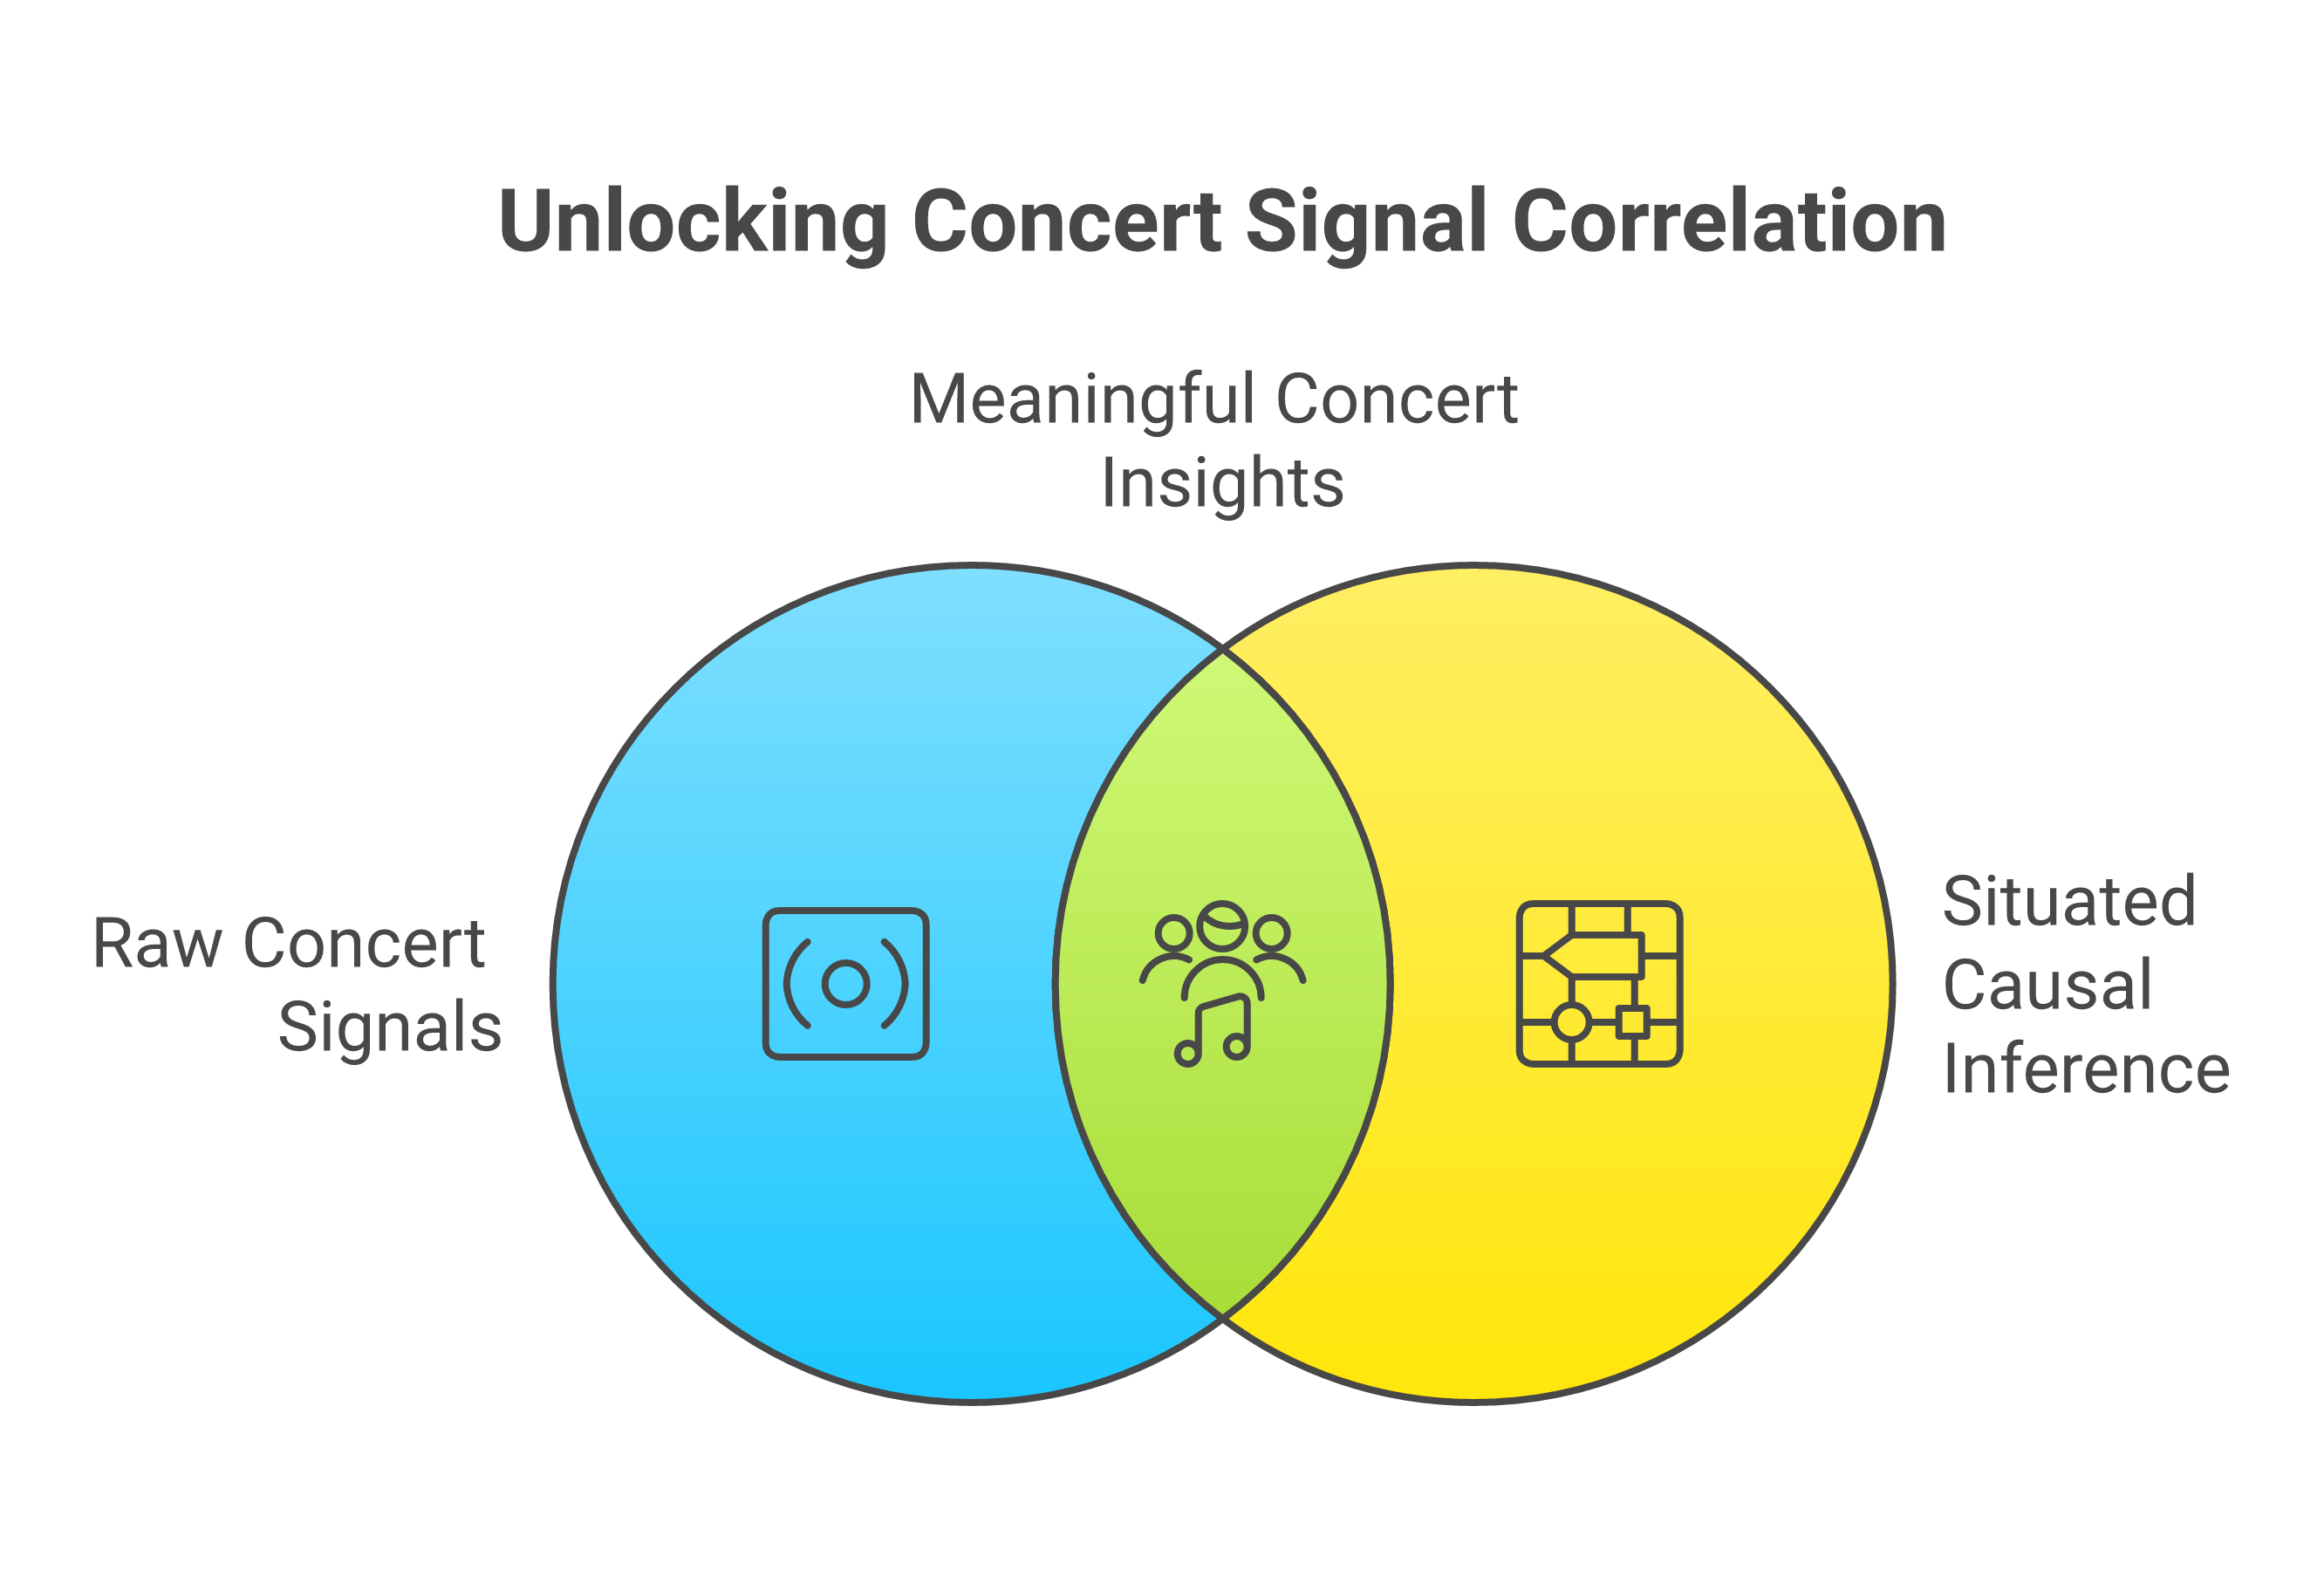
Concert’s correlation engine is responsible for associating signals with the entities in the dependency graph, grouping related signals into situations, and determining probable causal relationships within those situations [1].
The first stage of correlation is entity association: mapping each incoming signal to the entity or entities in the dependency graph that it describes. For Instana metrics and traces, this mapping is natural: Instana already identifies signals by service, process, and infrastructure component identifiers that align with Concert’s discovery. For log-derived signals and ITSM events, Concert applies rule-based and learned mapping to associate the signal source identifier—a hostname, a service name string, a change record application field—with the corresponding graph entity. Entity association quality depends on naming consistency across the estate; organisations with well-governed naming conventions see higher association rates than those where service names vary across observability, ITSM, and infrastructure systems.
The second stage is signal grouping, the process of assembling individually associated signals into situations—coherent clusters of signals that appear to describe related conditions. Concert’s grouping algorithm applies three classes of evidence. Temporal proximity captures the observation that signals describing a common cause will typically appear within a bounded time window of each other; Concert’s temporal correlation window is configurable and typically set to reflect the expected propagation delay of failures through the dependency graph. Topological proximity captures the observation that signals on strongly connected entities in the dependency graph are more likely to share a cause than signals on unrelated entities; Concert weights co-occurrence of signals by the graph distance between their associated entities. Semantic similarity captures the observation that signals carrying similar content—the same error code, the same affected resource type, the same process name—are more likely to be related than signals with dissimilar content.
The combination of temporal, topological, and semantic correlation allows Concert to construct situations that are meaningfully larger than individual alerts while remaining meaningfully smaller than the undifferentiated alert storm that traditional monitoring systems produce. Rather than paging an operator with forty separate alerts for a database failure and its cascading effects on twenty dependent services, Concert produces a single situation describing the database failure and its downstream impact, with the affected services listed as evidence [1]. The alert storm problem is not solved by suppression—the information is not discarded—but by organisation: the signals are grouped in a way that makes their relationships explicit rather than leaving the operator to reconstruct them under pressure.
14.3.3 Causal inference
The most demanding reasoning that Concert performs is causal inference: distinguishing within a situation which signal is the probable cause and which are probable effects. This distinction matters because remediation should target causes, not effects; restarting every affected service when the root cause is a database resource exhaustion is ineffective and potentially destabilising.
Concert approaches causal inference by combining graph-based reasoning with pattern matching against historical incident data. Graph-based reasoning follows the dependency edges in the entity model: if entity A depends on entity B, and both are showing degraded signals in the same situation, the signal on B is a candidate cause of the signal on A. This reasoning is applied iteratively up the dependency graph to find the deepest entity in the call chain that shows a degraded signal, which is the most likely root cause. IBM Research has published on the application of causal inference methods to AIOps, demonstrating the value of topology-aware causal reasoning over pure statistical correlation [5].
Pattern matching supplements graph-based reasoning with historical knowledge. Concert maintains a library of incident patterns derived from historical situations and their resolutions. When a current situation matches a historical pattern with sufficient confidence—the same entity types, the same signal types, the same temporal structure—the historical causal attribution is applied as a prior in the current analysis. This pattern library is built incrementally from operator feedback: every time an operator accepts or overrides Concert’s causal attribution, the outcome is recorded and used to refine future pattern matching.
14.4 The recommendation engine
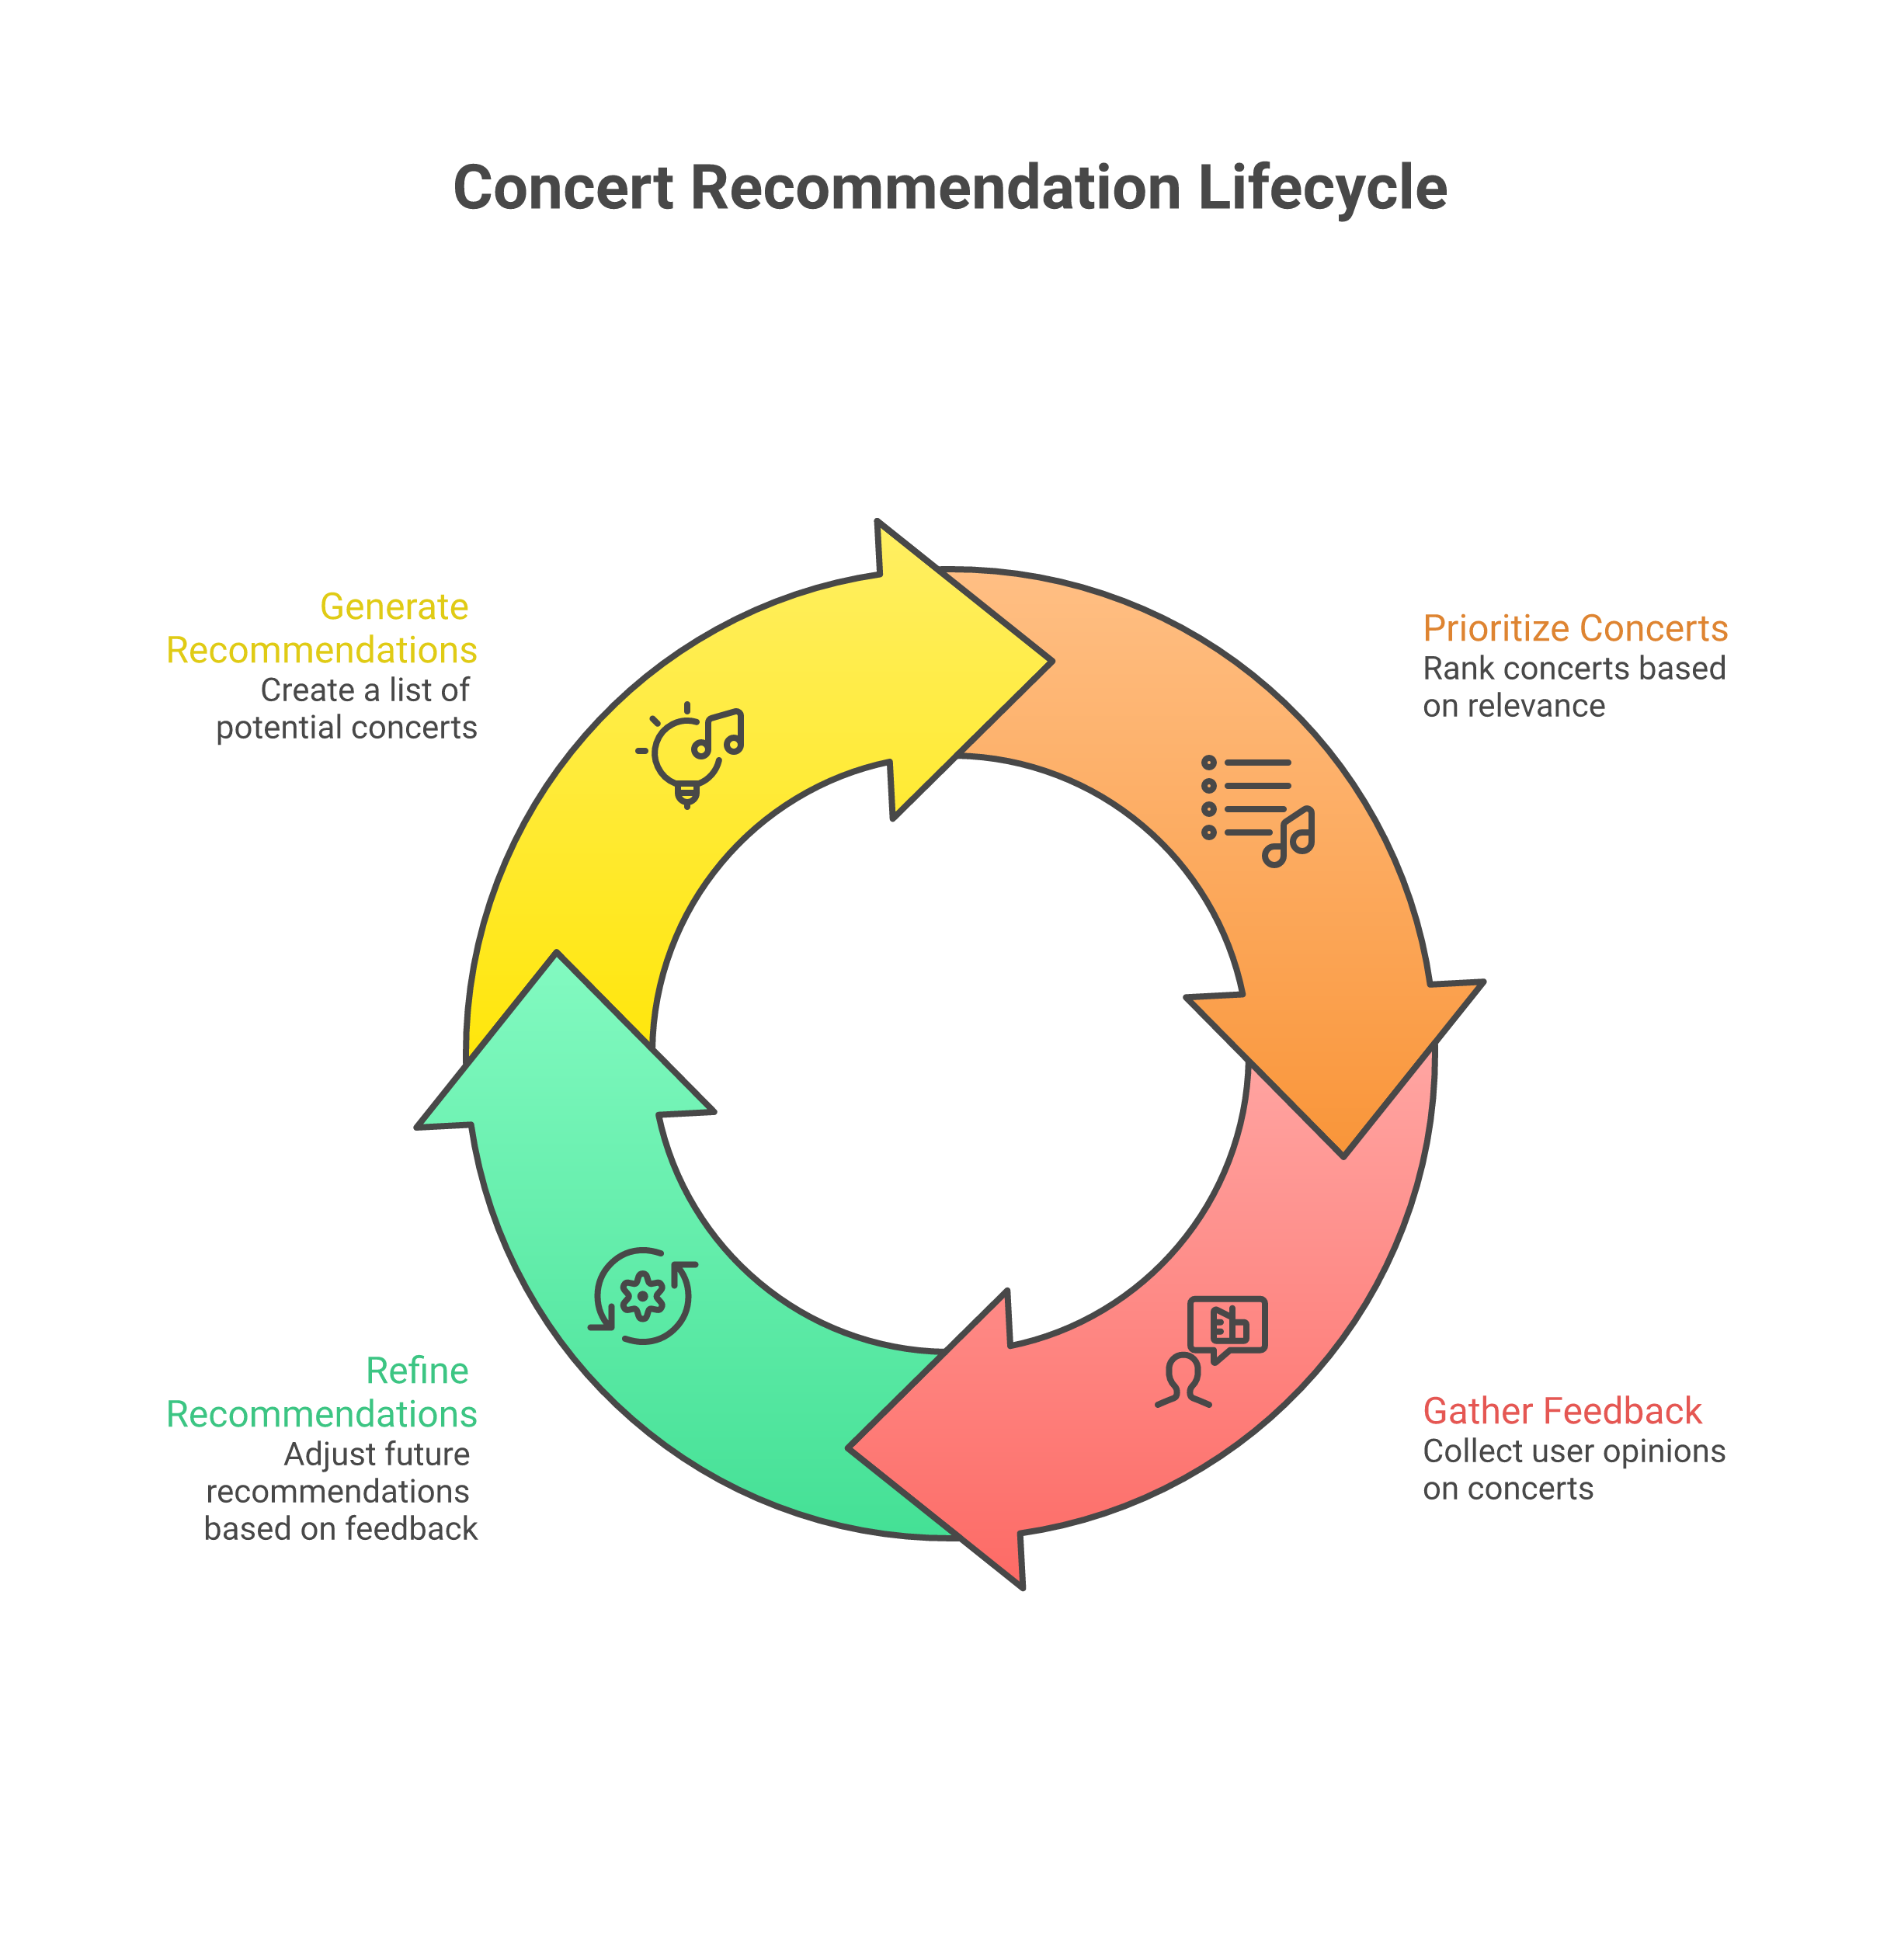
Concert’s recommendation engine translates the output of signal correlation and causal inference into actionable guidance. A situation with a probable cause is analytically useful but operationally insufficient; what operators and agents need is a prioritised list of things to do, each backed by explicit evidence and an assessment of expected outcome and risk [1].
14.4.1 Recommendation generation
Recommendations are generated by combining four inputs: the situation and its causal inference, the topology context of the affected entities, historical patterns of successful remediation, and the policy constraints applicable to the affected sovereign zone and service classification.
The situation and causal inference provide the problem statement: what is wrong, what is probably causing it, and which entities are affected. The topology context provides the operational setting: what is the criticality of the affected business service, what is the current load on the affected entity, what other services share dependencies that might be affected by remediation actions, and what sovereign zone constraints apply to the affected components. Historical remediation patterns provide the action candidates: given this type of cause in this type of entity, what remediations have been effective in the past, and with what success rates. Policy constraints filter the candidate actions: remediation actions that would require changes to components in a restricted sovereign zone, that would exceed the automated action envelope defined for this service class, or that conflict with active change freeze windows are excluded from the recommendation set before it is presented [1].
The output of recommendation generation is a structured recommendation record containing: a description of the recommended action in natural language and machine-executable form, the causal evidence supporting it, the entities it affects, the expected impact of the action if successful, an estimate of the risk of the action (probability and severity of adverse effects), and the confidence score for both the causal attribution and the expected outcome. This structure is important: it gives operators the information they need to make an informed decision and gives Orchestrate agents the structured input they need to execute the action if it falls within their bounded autonomy envelope.
14.4.2 Recommendation categories
Concert produces recommendations in four operational categories.
Investigation recommendations propose diagnostic actions that will clarify the situation without making changes to the estate. These might include collecting a thread dump from a specific JVM process, running a connectivity test between two services, querying the database slow query log for the relevant time window, or inspecting the Kubernetes events for a specific namespace. Investigation recommendations are typically low-risk and are candidates for automated execution at lower autonomy levels; they are particularly useful when Concert’s causal confidence is below a threshold that would justify a corrective action recommendation.
Configuration change recommendations propose specific, bounded changes to system configuration: adjusting a connection pool size, modifying a Kubernetes resource limit, updating a cache eviction policy, rotating a certificate approaching expiry. These recommendations are specific enough to be executed as structured automation actions by Orchestrate agents calling into Ansible playbooks or cloud provider APIs. They carry a risk estimate based on historical outcomes of similar changes in similar contexts [1].
Capacity action recommendations propose scaling or resource allocation changes: scaling a deployment’s replica count, increasing node pool size, provisioning additional database capacity, or adjusting an auto-scaling policy threshold. In estates where Concert has integration with IBM Turbonomic, capacity recommendations may be enriched with Turbonomic’s resource optimisation analysis, which brings workload performance and efficiency considerations together with Concert’s reliability-focused view [6].
Escalation recommendations propose that a situation be routed to a specific team or individual, or that an ITSM incident or change record be created. Concert generates escalation recommendations when the causal analysis exceeds its confidence threshold for automated action, when the affected entities are classified at a criticality level requiring human review, or when applicable policy constraints explicitly require human approval for the remediation class. Escalation recommendations include a pre-filled incident summary, the supporting evidence, and the proposed remediation steps, reducing the manual effort required to open and populate an ITSM record.
14.4.3 Priority scoring
Concert’s recommendations are sorted by a priority score computed from three weighted dimensions. Urgency reflects how quickly the current condition, if unaddressed, is likely to result in SLA breach, customer impact, or regulatory non-compliance. Urgency is derived from the rate of change in the situation’s signals, the current headroom against SLA thresholds, and any active business event signals indicating that impact is already occurring. Confidence reflects how certain Concert’s causal inference is, and how well-validated the proposed remediation is from historical patterns. A high-urgency, low-confidence recommendation should be treated differently from a high-urgency, high-confidence one; the priority scoring system makes this distinction explicit. Impact reflects the scale of business consequence, derived from the criticality classifications of the affected business services and the blast radius of the current situation across the dependency graph [1].
The weights applied to these three dimensions are configurable at the organisation level, allowing Concert’s priority ordering to reflect the organisation’s actual risk appetite and business priorities rather than a vendor-defined default. Financial services organisations subject to DORA [7] requirements for rapid resilience may weight urgency heavily; organisations managing regulated data workloads may weight impact assessment differently for situations involving sensitive data entities.
14.4.4 The feedback loop
Concert’s recommendation quality improves over time through a structured feedback loop that captures the outcomes of human accept, modify, and override decisions [1]. When an operator accepts a recommendation and the resulting remediation resolves the situation, that outcome is recorded as positive evidence for the causal inference and remediation pattern used. When an operator overrides a recommendation—choosing a different action or marking the causal attribution as incorrect—the override is captured as negative evidence and the pattern is adjusted. When an operator modifies a recommendation before acting on it—changing a parameter, adding a step, excluding an affected entity—the modification is captured as refinement signal.
This feedback mechanism requires careful design to avoid introducing bias. If operators systematically override certain recommendation types because they distrust Concert’s analysis in those cases, the feedback signal will suppress those recommendations even when they would have been correct. Concert’s feedback interface therefore captures not just accept/override decisions but the operator’s stated reason for overriding, which allows the pattern library to distinguish between “causal attribution was wrong” and “action was correct but not permitted in this context” and update accordingly.
Kleppmann’s analysis of event-driven data systems [8] provides relevant theoretical grounding for this kind of feedback architecture: the key insight is that the feedback event log must be treated as an immutable record from which the pattern library’s current state is derived, not as a set of direct mutations to the library. This allows the pattern library to be replayed, audited, and corrected if errors are discovered in the feedback processing logic.
14.5 The Concert data model and APIs
Concert’s architecture is built around a graph database that serves as the persistent store for the entity model, the signal correlation state, and the recommendation history. Understanding Concert’s data model and API surface is essential for architects who are integrating Concert into a sovereign operations architecture, particularly for those building Orchestrate agents that call Concert as a tool [1].
14.5.1 The graph database
The Concert graph database represents the estate as a property graph: nodes are entity instances with typed attributes, and edges are typed relationships between entity instances. The primary node types are: ServiceEntity (a logical service within the application architecture), DeploymentEntity (a running instance of a service in a specific environment and zone), InfrastructureEntity (a compute, storage, network, or database resource), ExternalAPIEntity (a third-party or SaaS endpoint on which internal services depend), and ZoneEntity (a sovereign zone definition). The primary edge types are: dependsOn (directed dependency between entities), isInstanceOf (from deployment to service), hostedOn (from deployment to infrastructure), isZoneMember (from any entity to its zone assignment), and signals (from any entity to associated signal records) [1].
Signal records are attached to entity nodes as time-windowed property sets rather than as separate graph nodes, reflecting their role as attributes of entity state rather than as first-class objects in the topology model. Situation records aggregate multiple signal records from one or more entities and carry the correlation state—which signals are grouped, what causal inference has been applied, what confidence scores are attached. Recommendation records are attached to situation records and carry the full recommendation structure described in section 14.4.
The graph database supports temporal queries: the state of the entity model at any historical point can be reconstructed from the record of entity creations, updates, and deletions. This temporality is important for post-incident analysis, where understanding what the topology looked like at the time of an incident is as important as understanding what it looks like now, and for the governance audit trail discussed in section 14.7.
14.5.2 The Concert API surface
Concert exposes its functionality through a REST API, a WebSocket event API, and a Concert SDK for agent development.
The REST API provides CRUD operations on entity model components, query interfaces for situations and recommendations, and action interfaces for submitting operator feedback and triggering recommendation re-evaluation. Key REST endpoints include: the entity graph query interface, which accepts graph traversal queries and returns entity subgraphs with their associated signals; the situation list interface, which returns the current set of open situations filtered by zone, entity type, priority, and status; the recommendation interface, which returns ordered recommendations for a given situation or across all open situations; and the feedback submission interface, which accepts operator accept/modify/override decisions and their associated reasons [1].
The WebSocket event API provides a real-time subscription interface for clients that need to react to new situations, updated recommendations, or entity model changes as they occur. Orchestrate agents and operator console components use this API to receive push notifications rather than polling. The event schema follows the CloudEvents specification, providing a standard envelope for event metadata that allows Concert events to be routed through cloud-native event infrastructure such as Kafka or cloud provider event buses without Concert-specific middleware [9].
The Concert SDK is an agent development toolkit that wraps the REST and WebSocket APIs in idiomatic client libraries for the primary agent runtime environments. It provides type-safe access to Concert’s entity model, signal records, situations, and recommendations, and includes helper utilities for common agent patterns: querying the highest-priority situations for a given zone, subscribing to recommendations for a given entity, submitting feedback with structured reason codes. When Orchestrate agents call Concert as a tool—asking “what is the current resilience posture of the payments platform?”—they do so through Concert SDK calls that are translated to REST API requests, with the SDK handling authentication, retry logic, and response deserialization [1].
14.6 Multi-cloud integration architecture
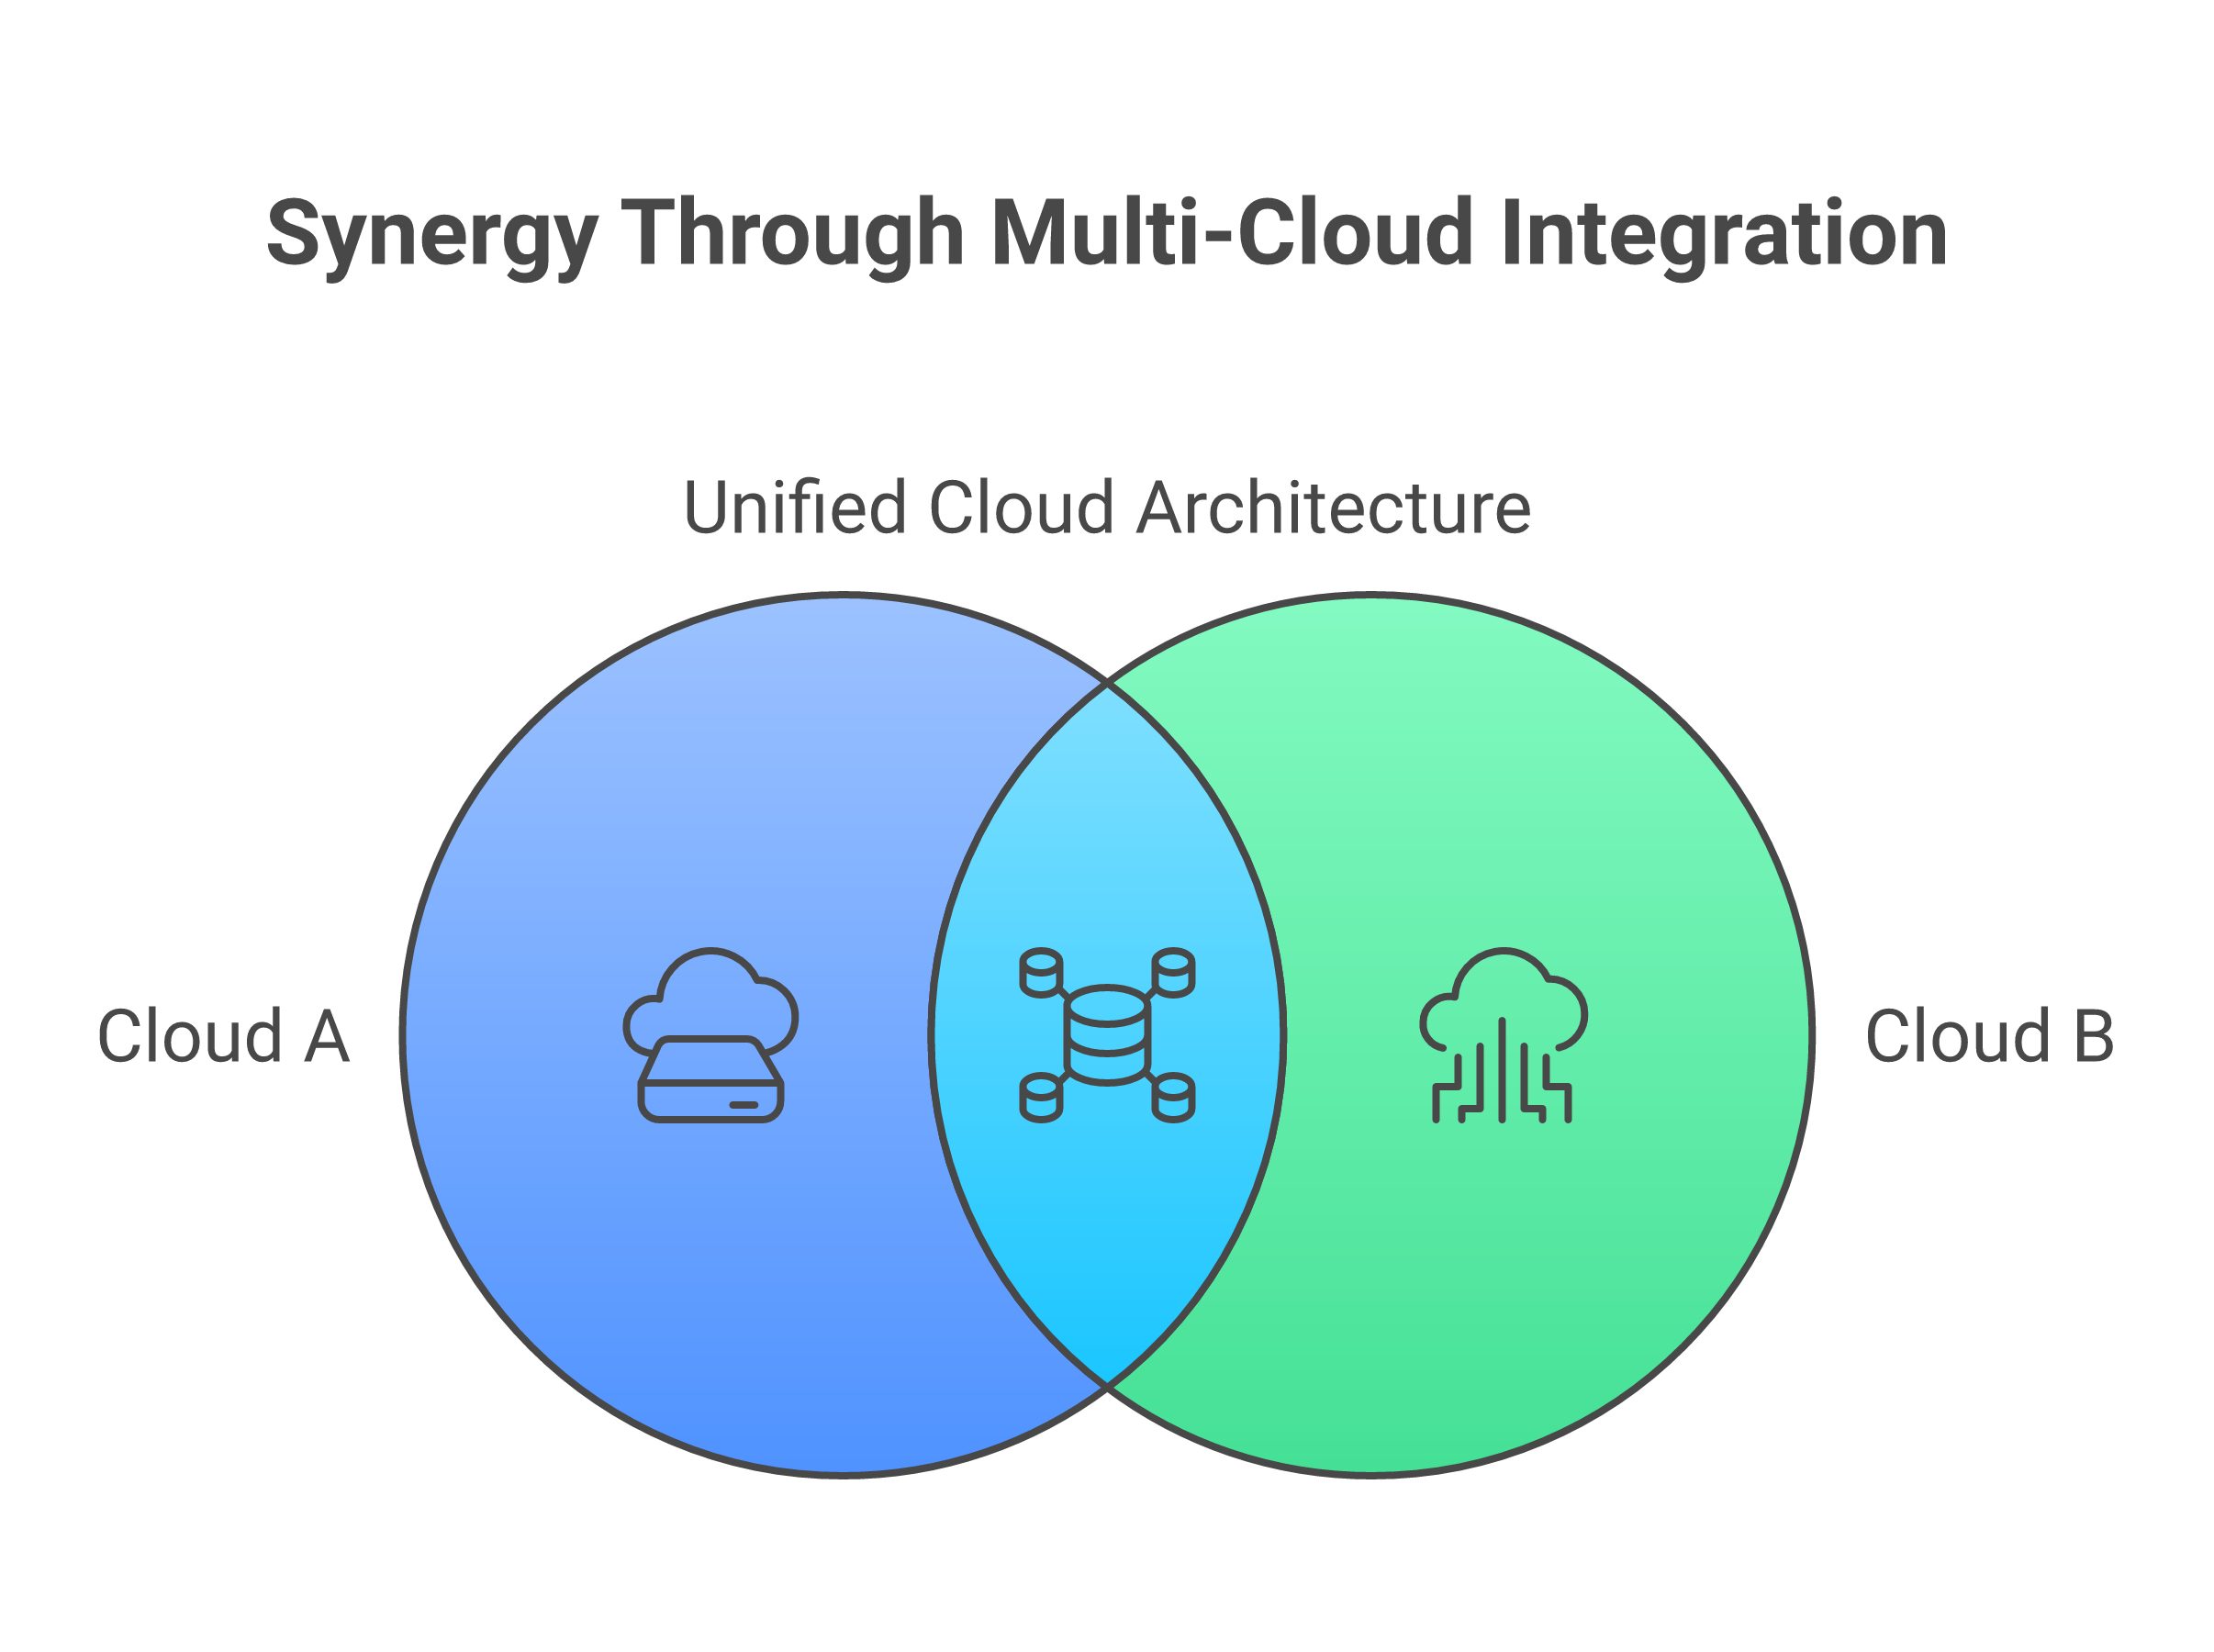
Concert’s usefulness across a multi-cloud estate depends on its ability to ingest topology and signals from heterogeneous cloud environments without requiring those environments to be reconfigured to match a Concert-specific data model. The integration architecture achieves this through a collector agent pattern, in which lightweight, cloud-native collector processes run within each cloud account, subscription, or on-premises environment and are responsible for translating the local resource model into Concert’s entity format [1].
14.6.1 Collector agents per cloud provider
For each major cloud provider, Concert’s integration architecture deploys a dedicated collector agent process within the customer’s cloud account or subscription. The collector agent for AWS runs as an ECS task or Lambda function and queries the AWS APIs—EC2, EKS, RDS, ElastiCache, Route 53, IAM, CloudWatch—using an IAM role with a defined, minimal set of read permissions. It does not require administrative permissions and does not write to any AWS resource; its permission model is explicitly read-only for discovery and signal collection. Collected data is normalised to Concert’s entity format and transmitted to the Concert backend over an encrypted, authenticated connection [1].
The Azure collector agent runs as an Azure Container Instance or Azure Function and uses a service principal with a Reader role scoped to the relevant subscription or resource group. For GCP, the collector runs as a Cloud Run service or Compute Engine instance with a service account holding the Viewer role for the monitored project. For IBM Cloud, the collector integrates natively with IBM Cloud API keys scoped to the relevant account and uses the IBM Cloud Kubernetes Service and Red Hat OpenShift on IBM Cloud APIs directly. The principle applied consistently across all collectors is least-privilege read access: the collector can see what it needs to see for discovery and signal collection, and nothing more.
The data transmitted from each collector to the Concert backend comprises entity records (new, updated, and deleted entity discoveries), signal snapshots (current metric values, active alert states), and change events (from the cloud provider’s event stream). The collector is responsible for deduplication and rate-limiting of its outbound data stream, ensuring that normal cloud provider API throttling does not cause gaps in Concert’s entity model [1].
14.6.2 On-premises integration
For on-premises environments and private data centres, Concert’s integration relies on Instana agents and the Kubernetes API server accessible within the environment. Instana’s agent architecture places a single infrastructure agent on each monitored host; these agents collect metrics, traces, and dependency maps and transmit them to the Instana backend, from which Concert draws its on-premises signals [3]. For on-premises Kubernetes clusters where direct Kubernetes API access is required, Concert deploys a Kubernetes collector within the cluster, analogous to the cloud provider collectors but using the cluster’s internal API server address.
IBM Cloud Satellite extends the IBM Cloud control plane to on-premises and edge locations, creating a managed Kubernetes environment that appears to Concert’s IBM Cloud collector as part of the IBM Cloud estate while physically running in the customer’s own facilities [10]. This architecture is particularly valuable in sovereign deployments where workloads must remain on-premises or within a specific facility but where the operational model benefits from the consistency of cloud-native management. Concert’s zone-aware entity tagging ensures that Satellite-hosted entities are correctly associated with their physical zone rather than their logical cloud account, preserving sovereignty intent in the entity model.
14.6.3 Concert backend deployment models
Concert’s backend is available in two deployment configurations whose selection is driven by the sovereign requirements of the deployment.
The SaaS deployment hosts the Concert backend—including the graph database, correlation engine, recommendation engine, and API surface—in IBM Cloud, managed by IBM. Collector agents in customer environments transmit data to the SaaS backend over encrypted channels. This model minimises operational overhead for the Concert platform itself and provides IBM’s managed service SLA, but it requires that topology and signal data leave the customer’s cloud accounts and reside in IBM Cloud. For organisations whose data residency obligations permit operational metadata of this kind to reside in IBM Cloud, the SaaS model is the lower-friction option [1].
The on-premises deployment installs the Concert backend within the customer’s own infrastructure, typically on an OpenShift cluster within a sovereign zone. In this model, the graph database, correlation engine, recommendation engine, and API layer all run within the customer’s environment, and no topology or signal data leaves the sovereign boundary. This deployment model is appropriate for organisations with strict data residency requirements that extend to operational metadata—regulated financial institutions and defence-sector organisations are typical examples—and for sovereign cloud programmes where regulators have explicitly addressed the residency of operational management data [1]. The governance and audit trail that Concert maintains, discussed in section 14.7, remains entirely within the sovereign boundary in this configuration.
14.7 Concert in the four-planes model
Concert’s position in the four-planes architecture introduced in Chapter 4 is not confined to a single plane. It is primarily the implementation of the Agentic Intelligence Plane—the system that interprets signals, reasons about the estate, and generates recommendations—but it also contributes substantively to the Observability Plane, the Automation and Orchestration Plane, and the Governance and Audit Plane. Understanding these cross-plane contributions is important for architects who are designing Concert’s integration with the rest of the sovereign operations stack.
14.7.1 Concert as the primary Agentic Intelligence Plane implementation
Concert is designed to implement the core functions of the Agentic Intelligence Plane as defined in Chapter 4: maintaining the estate model through topology discovery, ingesting and correlating signals across the estate, generating prioritised recommendations, and providing the data and API surface that Orchestrate agents use as their operational context. The estate model that Concert maintains—the dependency graph enriched with live signal state and historical patterns—is the foundational cognitive substrate for all agent operations in the sovereign stack.
Orchestrate agents consuming Concert’s APIs function as extensions of Concert’s recommendation execution capability. An agent that is invoked in response to a Concert recommendation—to collect additional diagnostic information, to execute a recommended configuration change, to create an ITSM record—is executing Concert’s reasoning as an automated workflow. The closed loop between Concert’s reasoning and Orchestrate’s execution is what transforms Concert from a recommendation display system into a genuine operational intelligence layer capable of driving coordinated action across the estate [11].
14.7.2 Concert’s contribution to the Observability Plane
Concert contributes to the Observability Plane through topology enrichment: the entity model it maintains becomes the structural context within which observability signals are interpreted. Without Concert’s topology model, Instana’s metrics and traces describe the state of individual services but do not reveal which business services are affected by degradation in those individual services. With Concert’s topology model, every signal is contextualised within the dependency graph, turning an observation about a database’s connection pool into a statement about the likely impact on the three business services that depend on it [1].
Concert’s entity model can be consumed by observability tools as enrichment metadata. Dashboard configurations in Instana and other observability platforms can reference Concert’s entity identifiers to annotate their displays with topology context—showing not just that a service is experiencing high error rates but that those errors are propagating to dependent services, and which business capabilities are at risk. This bi-directional relationship between Concert and the observability plane creates a coherent operational picture that neither could provide alone.
14.7.3 Concert’s contribution to the Automation Plane
Concert’s contribution to the Automation and Orchestration Plane comes through recommendation-triggered workflow initiation. A Concert recommendation that falls within the bounded autonomy envelope of a deployed Orchestrate agent does not require an operator to read the recommendation, decide to act, and manually initiate a workflow; it can trigger the workflow directly, with the recommendation record providing the action specification and the evidence [1]. This integration requires that Concert’s recommendation records are mapped to specific Orchestrate workflow templates, and that the mapping is governed by the policy constraints discussed in section 14.8.
Concert also contributes to the Automation Plane through change event ingestion and correlation. By consuming the change events produced by CI/CD pipelines, GitOps reconciliation processes, and ITSM change management, Concert closes the feedback loop between automation actions and their operational consequences. An automated deployment initiated by an Orchestrate agent in response to a Concert recommendation produces a change event that Concert ingests, associates with the affected entity, and uses as context when correlating subsequent signals. If the deployment resolves the situation, Concert’s feedback loop captures that as a positive pattern. If it introduces a new problem, Concert’s correlation engine will associate the new signals with the change event that preceded them, accelerating root cause identification.
14.7.4 Concert’s contribution to the Governance and Audit Plane
Concert’s contribution to the Governance and Audit Plane is its audit trail of recommendations and human responses. Every recommendation generated by Concert, every situation that gave rise to it, every operator decision to accept, modify, or override it, and every automated action taken in response to it is recorded as an immutable event in Concert’s graph database. This record is the operational evidence base for governance inquiries, post-incident reviews, and regulatory audits.
For organisations operating under DORA [7], which requires financial entities to demonstrate operational resilience through documented evidence of their detection and response capabilities, Concert’s audit trail provides a structured record of how operational events were detected, how they were characterised and prioritised, what responses were recommended, what decisions were taken, and what outcomes resulted. This is qualitatively different from the audit logs produced by traditional monitoring and ITSM systems, which capture what happened but not why it was prioritised as it was or what intelligence supported the decision. Concert’s audit trail captures the reasoning—the causal inference, the priority scores, the policy constraints—alongside the decision, making it possible for a regulator or internal audit function to review not just the action taken but the intelligence that supported it.
14.7.5 The Concert workspace
The Concert workspace is the operator-facing command centre that brings together the entity model, the current situation list, the prioritised recommendation queue, and the audit trail in a single interface. It provides a topology map view showing the current state of the estate with entity health overlays, a situation dashboard with drill-down into correlation evidence and causal analysis, a recommendation queue with accept/modify/override controls and feedback capture, and a historical view of resolved situations and their outcomes [1].
The Concert workspace is also the integration point for Orchestrate’s conversational interface. An operator who prefers to interact with Concert through natural language queries rather than through the graphical workspace can do so through an Orchestrate agent that translates natural language requests into Concert API calls and presents the results as conversational responses. “What is the current state of the payments platform?” and “What should we do about the top priority situation in the EU zone?” are queries that an Orchestrate agent can answer by querying Concert’s REST API and formatting the response—the entity health summary, the situation description, the top-ranked recommendation—as natural language output.
14.8 Sovereign-aware Concert deployment
The sovereign characteristics of a Concert deployment—which entities it knows about, which recommendations it generates, where its data resides, and how it enforces zone boundaries—are not configuration details to be addressed after the core deployment is complete. They are first-class architectural concerns that shape every aspect of Concert’s behaviour in a sovereign cloud programme.
14.8.1 Zone-tagged entities and zone-constrained recommendations
Concert’s entity model, as described in section 14.2.2, assigns a zone identifier to every entity at the point of discovery. This zone tagging is the foundation of all sovereign-aware behaviour in Concert. Zone-tagged entities allow Concert to answer zone-specific questions: what is the health of the services in the regulated EU zone? Which entities in the UK zone have dependencies on components in other zones? What recommendations are relevant to the operations team responsible for the North America zone?
Zone-constrained recommendations go further: Concert applies zone-aware policy constraints to recommendation generation, ensuring that proposed remediation actions do not require cross-zone changes that would violate sovereign boundaries. A recommendation to scale a database deployment, for example, will only propose scaling actions within the zone where the database is deployed; it will not propose moving the database to a different zone, even if that zone has more available capacity, unless the entity’s zone assignment explicitly permits cross-zone migration and the governing policy approves it [1].
The policy constraints that govern zone-aware recommendation scope are defined in Concert’s policy configuration and are aligned with the policy-as-code framework described in Chapter 10. Policy rules of the form “recommendations for entities tagged with zone=EU-regulated may not specify actions affecting entities tagged with a different zone” are evaluated by Concert’s recommendation engine before presenting recommendations to operators or agents. This evaluation is logged in the recommendation record, providing an auditable record of which policy constraints were applied to each recommendation.
14.8.2 Zone-partitioned data retention
Concert’s data retention configuration in a sovereign deployment applies zone-aware partitioning to the graph database. Entity records, signal records, situation records, and recommendation records for entities in a given sovereign zone are stored in a partition of the graph database that is logically (and in strict deployments, physically) separated from the partitions for other zones. Retention periods for each partition are configured to match the regulatory requirements applicable to the zone: a zone subject to strict data sovereignty obligations may require that all operational metadata be deleted after a defined period, while a zone with more relaxed requirements may retain data for longer for pattern learning purposes [1].
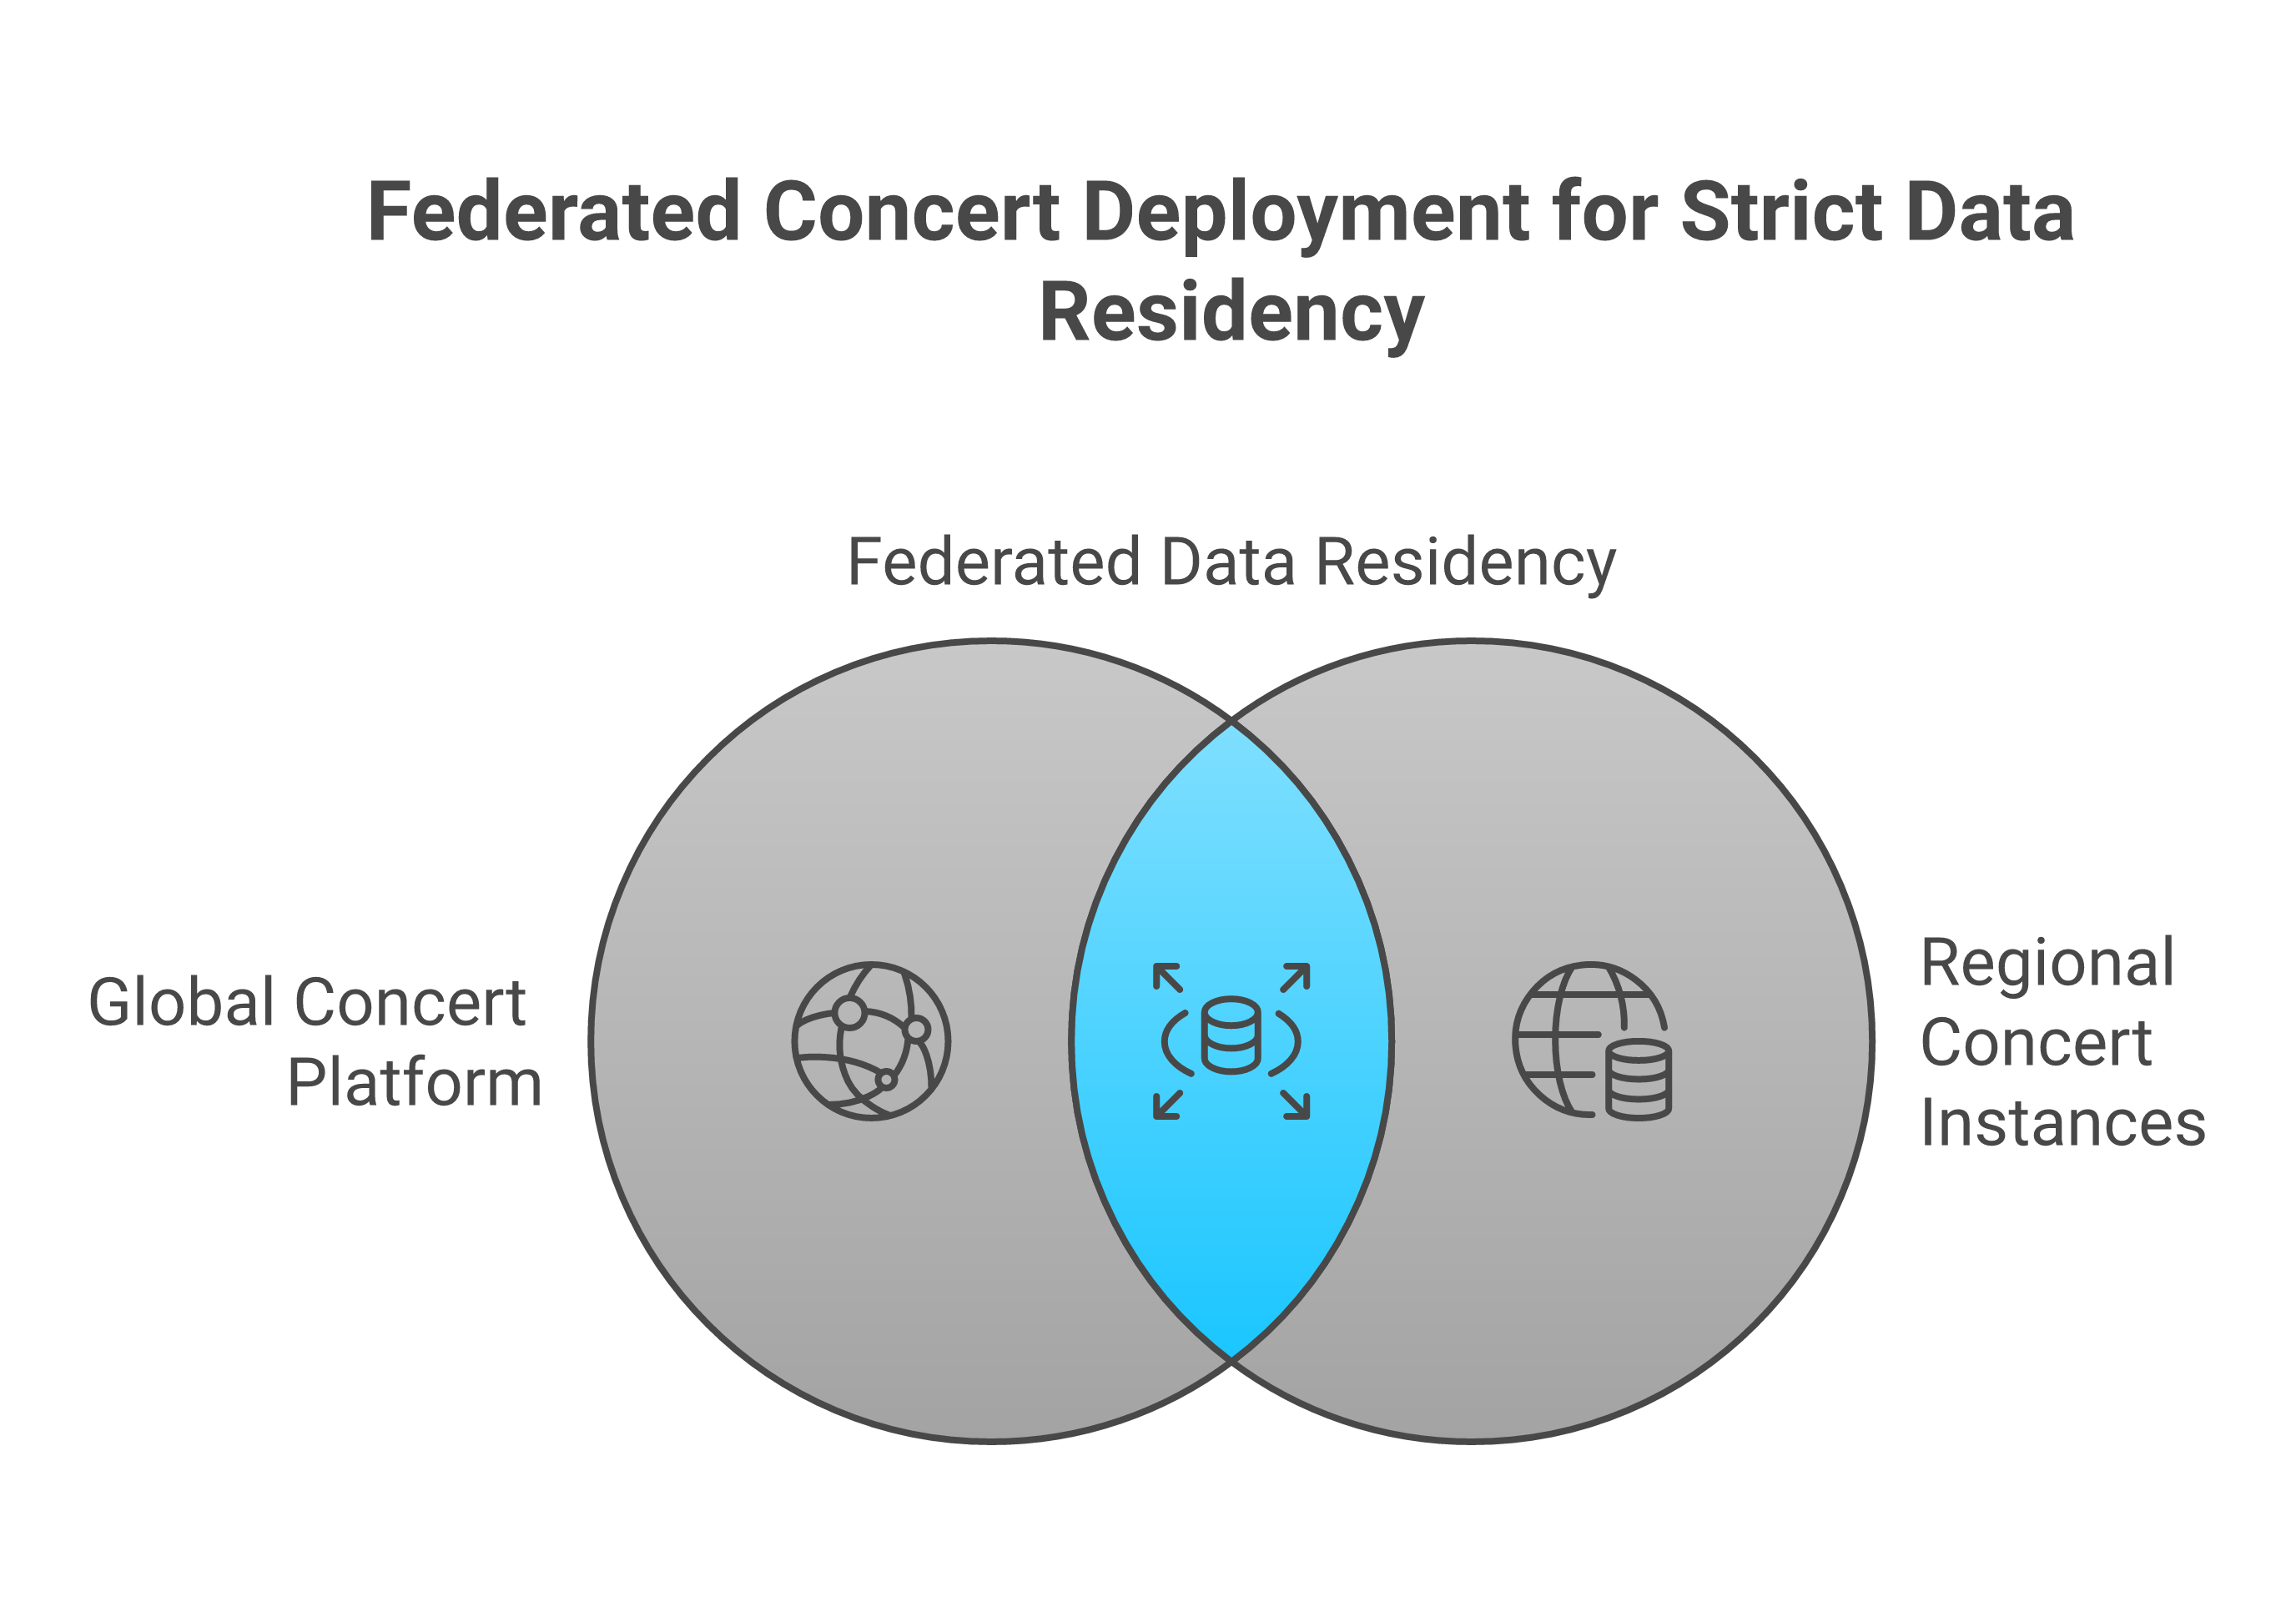
In a federated Concert deployment—where separate Concert backend instances are deployed in each sovereign zone rather than a single multi-zone instance—zone partitioning becomes zone isolation: each Concert instance has access only to the entity model and signal data for its own zone, with no cross-zone data sharing at the database level. Cross-zone operational visibility, where it is permitted by policy, is achieved through controlled API federation: a central Concert aggregation layer queries each zone’s Concert instance through its REST API, retrieves the aggregate-level health and situation summaries that policy permits to cross zone boundaries, and presents a multi-zone operational view without requiring the raw operational data of any zone to leave its boundary.
14.8.3 Concert data residency model
The Concert data residency model distinguishes three categories of data with different residency characteristics. The entity model—the topology graph and its attributes—is operational metadata that describes what runs where and how components relate. In most regulatory frameworks, entity model data is not personal data and not subject to the strictest data residency obligations, though some frameworks require that operational metadata describing regulated systems remains within the regulatory perimeter. The signal data—metrics, log-derived signals, change events—may contain sensitive operational content depending on the monitoring configuration; signals derived from financial transaction processing, for example, may carry sensitivity beyond general operational metadata. The recommendation and audit trail—the record of Concert’s reasoning and operator decisions—is generally classified as operational management data and is subject to organisational data governance policies [1].
Organisations must assess the residency requirements for each of these categories in the context of the regulatory frameworks applicable to their sovereign zones. The on-premises Concert deployment model, described in section 14.6.3, satisfies the most stringent residency requirements by ensuring that all three categories remain within the customer’s infrastructure. The SaaS model satisfies residency requirements where operational metadata is permitted to reside in a trusted cloud provider’s managed service. In either case, Concert’s zone-partitioned data model ensures that the residency question can be answered at the zone level, not merely at the level of the entire Concert deployment.
Key Takeaways
-
Concert is not a monitoring tool or an alert aggregator. It is a topology-first operational intelligence system that maintains a live dependency graph of the estate, correlates signals against that graph, and generates prioritised, evidence-backed recommendations. Its value proposition is causal understanding, not alert volume reduction.
-
Topology discovery is Concert’s foundational capability. Without an accurate, current entity model—built from Kubernetes APIs, cloud provider APIs, CMDB integration, and runtime-observed dependencies—Concert’s signal correlation and causal inference operate over an incomplete picture and produce unreliable recommendations.
-
Concert’s correlation engine applies temporal, topological, and semantic evidence to group signals into situations and infer probable causal relationships. This avoids alert storms not by suppression but by organisation: signals are grouped with their causal context made explicit rather than presented as independent events.
-
Recommendations are structured, multi-dimensional artefacts carrying action specification, supporting evidence, expected impact, risk assessment, and confidence score. Priority scoring across urgency, confidence, and impact dimensions reflects the organisation’s risk appetite and the affected business services’ criticality classifications.
-
Concert’s API surface—REST, WebSocket, and SDK—makes it callable as a tool by Orchestrate agents, enabling a closed loop in which Concert’s reasoning drives Orchestrate’s execution, with outcomes feeding back into Concert’s pattern library for continuous improvement.
-
The multi-cloud integration architecture deploys least-privilege, read-only collector agents per cloud account or subscription, normalising provider-specific resource models into Concert’s entity format. The on-premises Concert deployment keeps all operational metadata within the sovereign boundary for organisations with strict residency requirements.
-
Sovereign-aware Concert deployment requires zone-tagged entities, zone-constrained recommendation scope, zone-partitioned data retention, and—in the most stringent cases—federated Concert instances with policy-governed API federation rather than shared data across zone boundaries.
Bridge to Chapter 15 — IBM Concert Workflows
Concert’s architecture provides the operational intelligence layer, but intelligence is only as useful as the workflows that act on it. The recommendation records that Concert generates, the situations it identifies, and the causal attributions it makes are the inputs to a set of operational processes—investigation, remediation, change risk assessment, compliance verification—that must be designed and operated with the same rigour applied to Concert itself.
Chapter 15 examines how Concert’s outputs are translated into action: the workflow patterns that connect Concert recommendations to Orchestrate agent execution, the AIOps operational model that governs how situations are triaged, escalated, and resolved, and the change risk assessment processes that use Concert’s topology-aware intelligence to evaluate the potential impact of proposed changes before they are applied. This includes the integration with IBM DevOps Insights for deployment frequency, change failure rate, and mean time to restore metrics that together constitute the DORA four-key metrics picture for the organisation’s sovereign multi-cloud estate. Where Concert looks backward—correlating what has happened—DevOps Insights looks forward and sideways, assessing what a change is likely to do and measuring whether the operational model is improving over time. Together, they form the intelligence and measurement foundation that makes agentic operations accountable rather than merely fast.
References
[1] IBM, IBM Concert Documentation, IBM Cloud Docs, 2024. Available: https://www.ibm.com/docs/en/concert
[2] Gartner, Market Guide for AIOps Platforms, Gartner Research, 2023. [Online]. Available: https://www.gartner.com/en/documents/4022053
[3] IBM, IBM Instana Observability Documentation, IBM Cloud Docs, 2024. Available: https://www.ibm.com/docs/en/instana-observability
[4] OpenTelemetry Authors, OpenTelemetry Specification, Cloud Native Computing Foundation, 2024. Available: https://opentelemetry.io/docs/specs/otel/
[5] IBM Research, “AIOps: Artificial Intelligence for IT Operations,” IBM Journal of Research and Development, vol. 65, no. 5/6, 2021. [Online]. Available: https://doi.org/10.1147/JRD.2021.3054745
[6] IBM, IBM Turbonomic Documentation, IBM Cloud Docs, 2024. Available: https://www.ibm.com/docs/en/turbonomic
[7] European Parliament, Digital Operational Resilience Act (DORA) — Regulation (EU) 2022/2554, Official Journal of the European Union, 2022. [Online]. Available: https://eur-lex.europa.eu/legal-content/EN/TXT/?uri=CELEX%3A32022R2554
[8] M. Kleppmann, Designing Data-Intensive Applications, O’Reilly Media, 2017. [Online]. Available: https://www.oreilly.com/library/view/designing-data-intensive-applications/9781491903063/
[9] Cloud Native Computing Foundation, CloudEvents Specification, CNCF, 2024. Available: https://cloudevents.io
[10] IBM, IBM Cloud Satellite Documentation, IBM Cloud Docs, 2024. Available: https://www.ibm.com/docs/en/cloud-paks/cloud-pak-for-data/4.8?topic=satellite-overview
[11] IBM, IBM watsonx Orchestrate Documentation, IBM Cloud Docs, 2024. Available: https://www.ibm.com/docs/en/watson-orchestrate
Sovereign Cloud Operations: AI-Driven Management of Sovereign Estates
© 2026 by Alan Hamilton
is licensed under CC BY-SA 4.0


