Chapter 15 — IBM Concert: Workflows, AIOps, and Change Risk
Summary
This chapter traces the path from Concert’s intelligence to operational action, covering the three response modes (human-initiated, agent-assisted and automated), the four canonical AIOps workflow patterns (incident correlation, change risk assessment, capacity optimisation and proactive risk identification), and the situation lifecycle that replaces alert-by-alert investigation with unified, evidence-rich operational engagement. It explains Concert’s change risk scoring, its bidirectional integration with ITSM platforms such as ServiceNow, and the automation paths through IBM Ansible Automation Platform and GitOps pull requests that translate recommendations into auditable, governed execution. Architects will find guidance on configuring action risk classification thresholds, embedding human approval gates that cannot be bypassed under pressure, and measuring Concert’s operational impact through recommendation acceptance rate, mean time to resolution, change failure rate trends, false positive rate and operator escalation rate.
The previous chapter established Concert as the operational brain of the sovereign cloud estate: a system that ingests signals from dozens of monitoring sources, correlates them against a live application topology, and surfaces prioritised recommendations. A brain that merely recommends, however, is only half a story. The other half is what happens next — how those recommendations travel from Concert’s recommendation panel into the hands of operators, automation engines, and ultimately the infrastructure itself. That is the subject of this chapter.
Concert’s value proposition rests on a chain of translation: raw telemetry becomes correlated situations, situations become recommendations, and recommendations become actions. Each step in that chain involves judgement — human, algorithmic, or some combination of both — and each step must be traceable for audit and learning. Understanding how that chain works, where it can be tightened, and where human oversight must be preserved is essential for any organisation deploying Concert in a regulated or operationally sensitive environment.
15.1 From recommendations to action
Concert produces recommendations continuously. In a large estate, the recommendation panel may surface dozens of items in the course of a working day: remediate a misconfigured pod security policy, investigate a memory leak on a particular node pool, review a planned change that carries an elevated risk score, consolidate underutilised namespaces to reduce cost. The immediate operational question is always the same: what happens now?
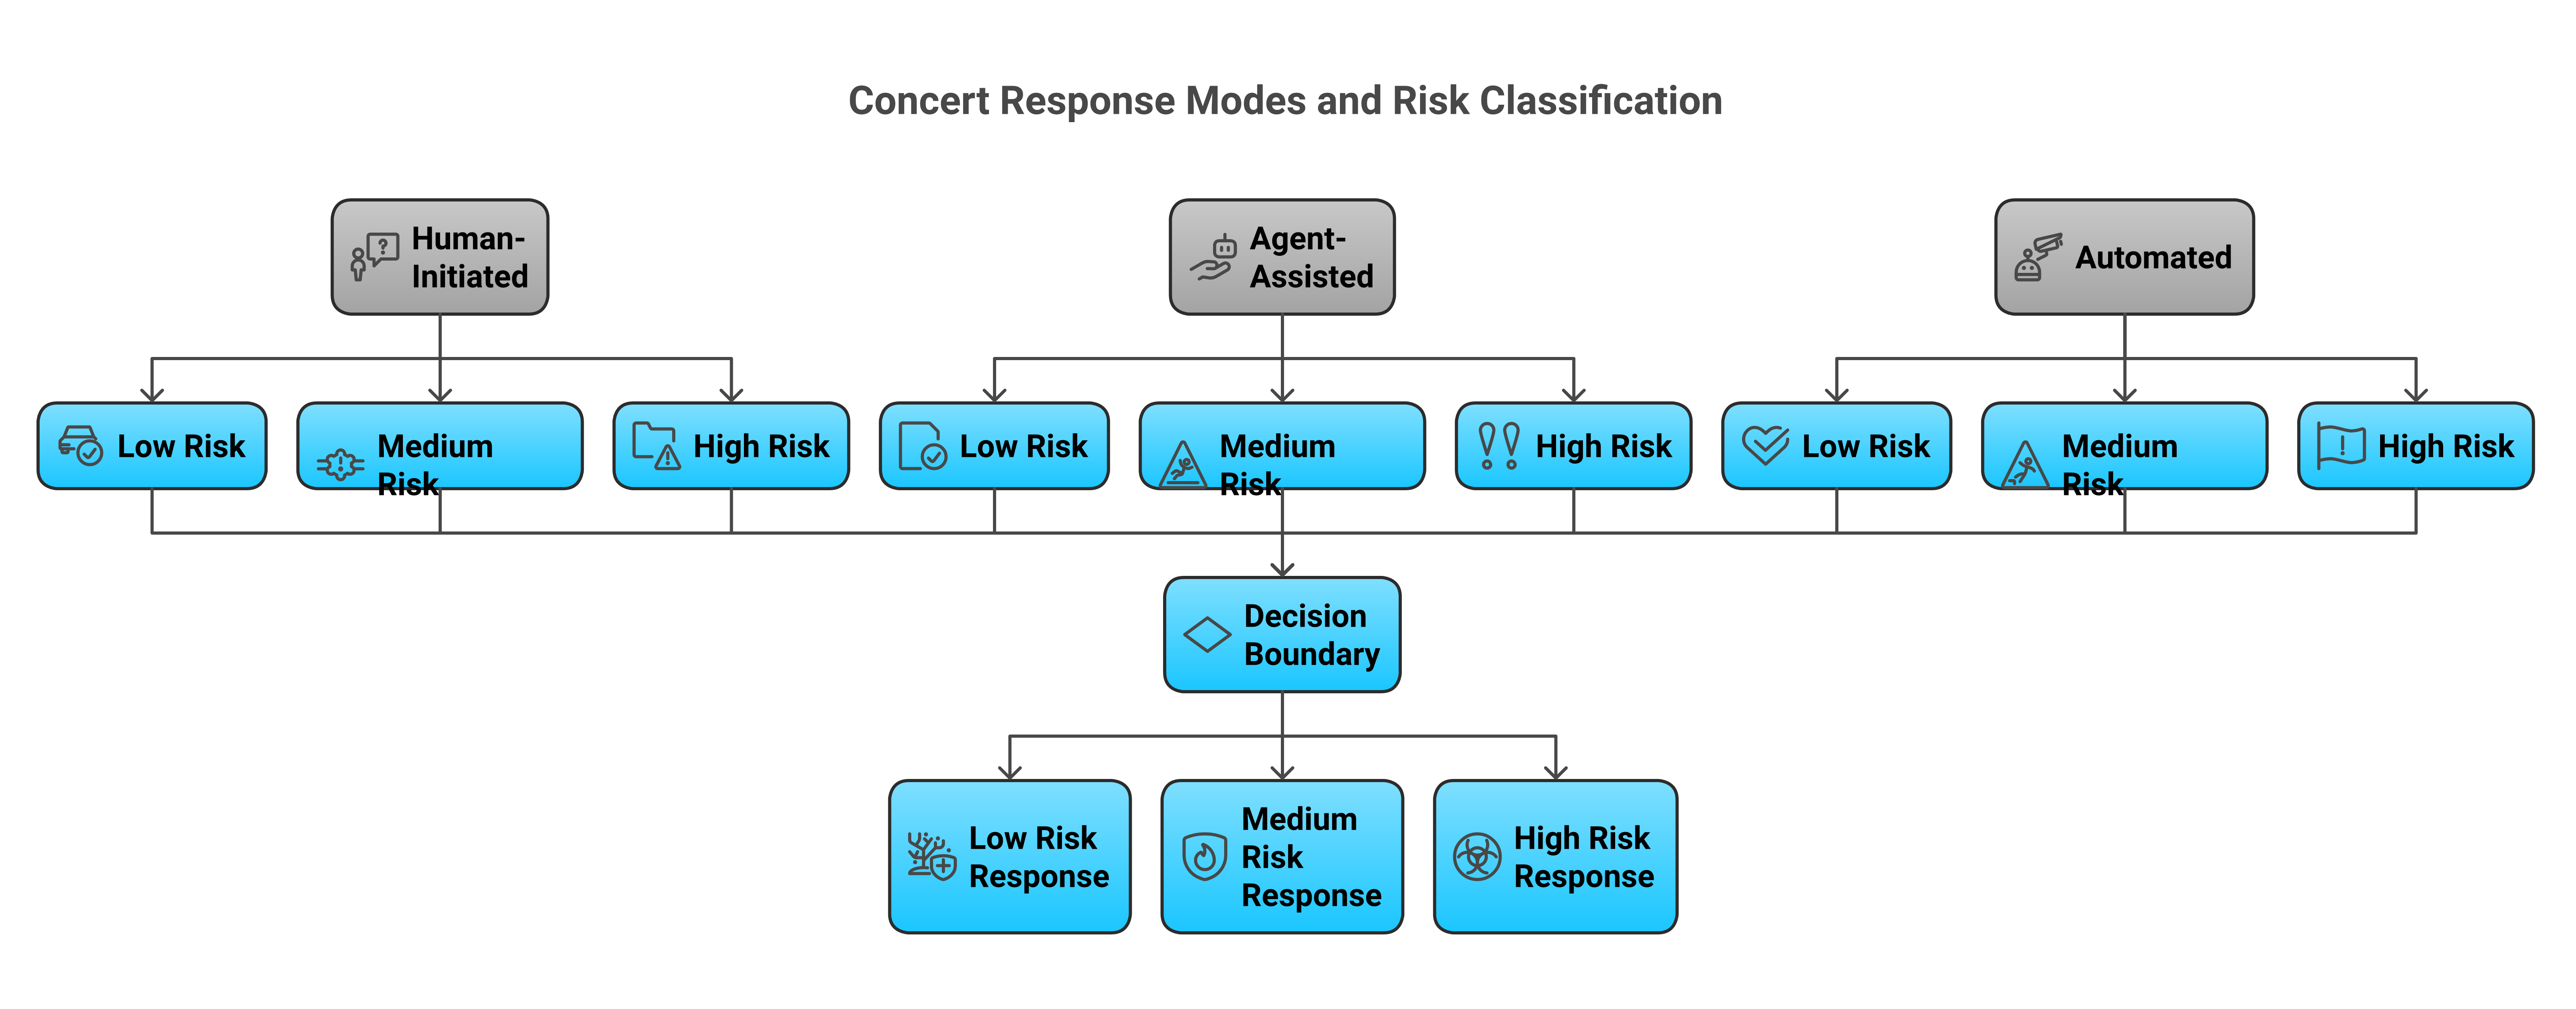
The answer depends on which of three response modes is configured for the recommendation in question.
The first is human-initiated action. Concert surfaces the recommendation with supporting evidence — affected components, correlated signals, historical context — and a human operator decides whether to act, how, and when. Concert may provide a suggested runbook or a pre-populated change request, but execution waits entirely on human decision and command. This is the baseline mode and remains the default for any recommendation category that has not been explicitly classified as eligible for a higher degree of automation.
The second is agent-assisted action, in which IBM Concert delegates the elaboration of a recommendation into an executable plan to IBM watsonx Orchestrate. Rather than presenting the operator with a raw recommendation, Concert hands off to Orchestrate, which reasons about the available automation tools, constructs a multi-step execution plan, and returns that plan to the operator for review and approval before a single command is issued [1]. The operator sees not just the recommendation but the proposed sequence of steps, the expected state changes, the policies that will be checked, and the rollback path if something goes wrong. Approval at this stage is a deliberate gate; execution without it is architecturally prevented. This mode is appropriate for well-understood remediation categories where the elaboration work is complex enough to benefit from automation but the risk is not yet low enough to dispense with human sign-off.
The third is automated action, in which a pre-approved playbook or automation job executes without per-instance human approval. This mode applies only to recommendation categories that have been classified through a formal risk assessment as low-risk, well-understood, and reversible, and it operates within guardrails defined in the Governance Plane. Automated actions are not unmonitored; every execution is logged, the outcome is reported back to Concert, and anomalies in execution trigger escalation to human review. In practice, automated responses are appropriate for a narrow set of operational patterns: restarting a crashing pod, rotating a near-expired certificate, scaling a deployment within pre-approved bounds, or clearing a known transient fault in a well-tested system [2].
What determines which response mode applies is action risk classification. Concert assigns each recommendation to a risk tier based on factors including the blast radius of the proposed action (how many dependent services or users would be affected if it went wrong), the reversibility of the change (whether state can be trivially restored), the historical failure rate for this class of action, the current health of the components involved, and whether the action falls within a pre-approved change category. The classification is not static; an action that is normally automated may be promoted to agent-assisted or human-initiated if Concert detects elevated system stress, a recent related incident, or an approaching maintenance window. This dynamic escalation is one of the ways Concert operationalises risk awareness rather than treating risk as a one-time configuration decision [1].
The practical implication for operations teams is that Concert’s workflow design is inseparable from the organisation’s risk appetite. Defining response modes requires a deliberate conversation between operations, security, and risk stakeholders about which categories of action are safe to accelerate and which must retain a human in the loop. That conversation, and its outcomes documented as policy, is as much a part of Concert deployment as the technical configuration itself.
15.2 Concert’s AIOps workflow patterns
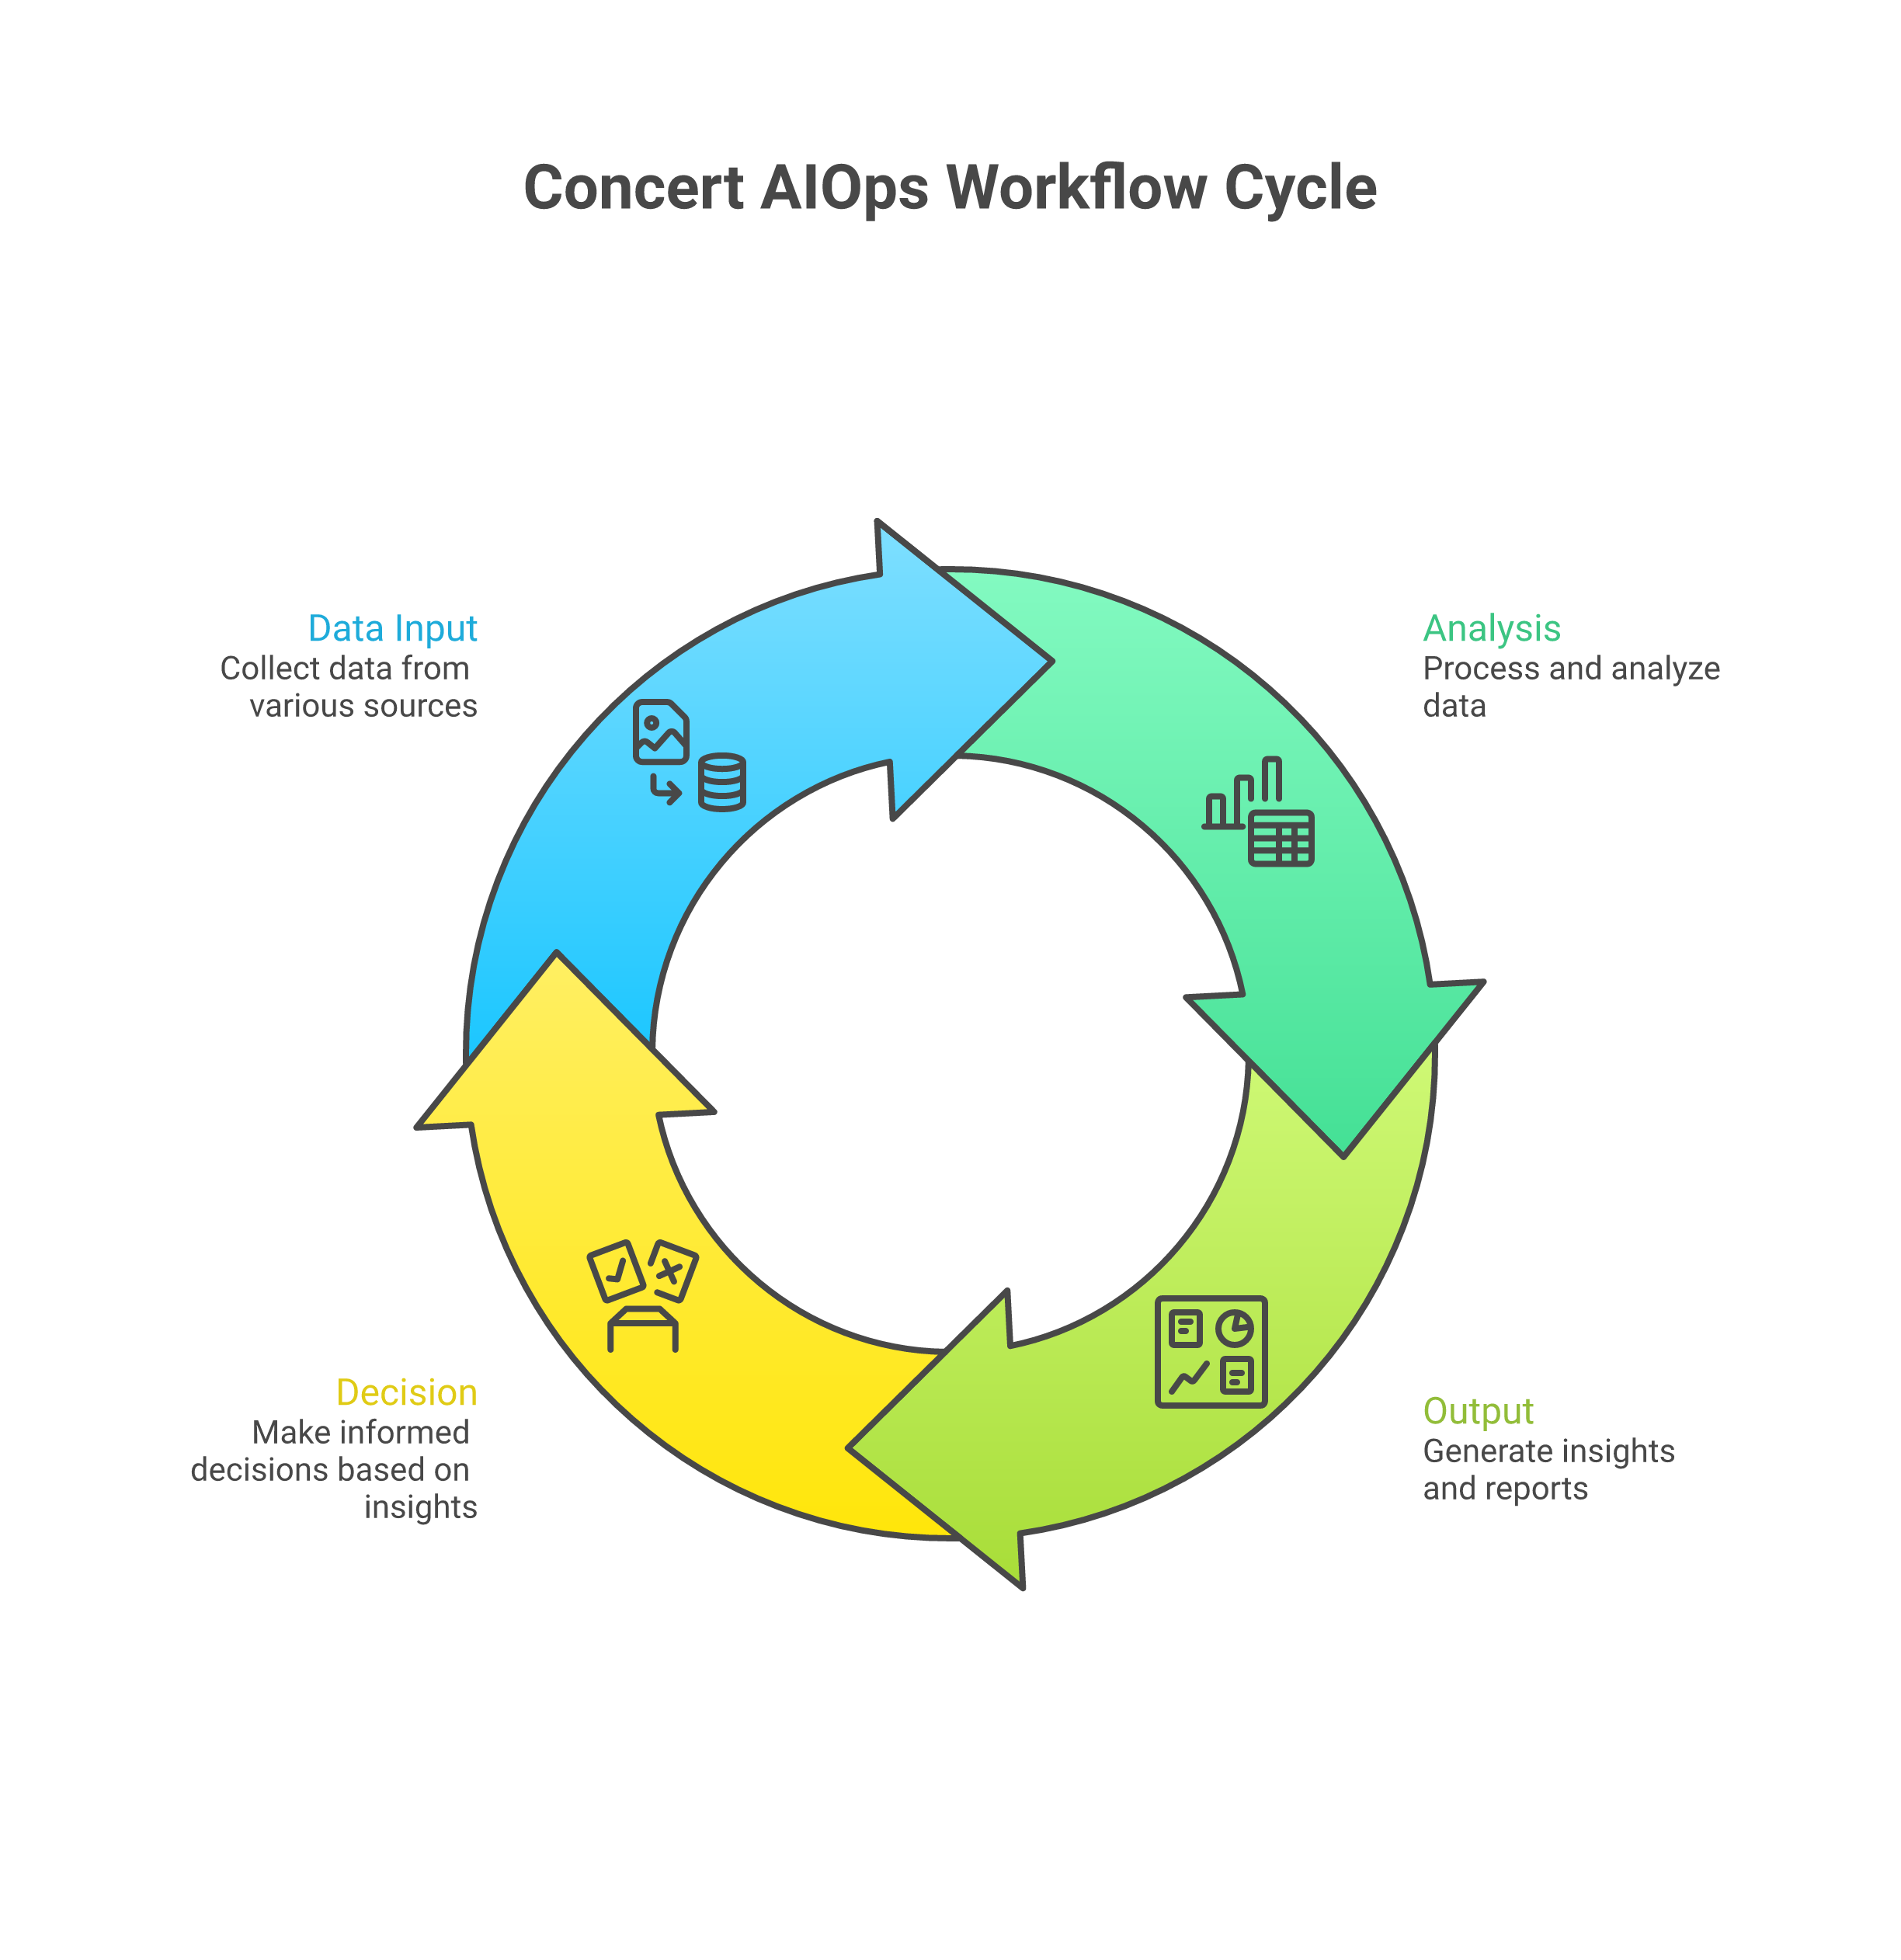
AIOps, as a discipline, has suffered from a surfeit of definitions and a shortage of concrete patterns [3]. IBM Concert operationalises AIOps through four canonical workflow patterns, each of which addresses a distinct operational challenge and involves a specific sequence of data ingestion, analysis, human or automated decision, and feedback.
The first pattern is incident correlation and triage. Traditional monitoring stacks produce alerts at the component level: a certificate expiry alert from the PKI system, a memory pressure alert from the node exporter, a connection pool exhaustion alert from the database monitoring agent. In a complex estate, a single underlying fault can generate dozens of related alerts across different tools and teams, each requiring separate acknowledgement and investigation. Concert’s correlation engine ingests these alerts alongside topology data, traces, and change records, and groups related signals into a situation — a unified representation of what appears to be a single operational problem, regardless of how many raw alerts it has spawned. The triage workflow assigns a severity to the situation based on the affected services’ business impact, surfaces the most likely root cause hypotheses, and routes the situation to the appropriate team or individual. Operators engage with the situation rather than with individual alerts, dramatically reducing cognitive overhead and duplicate investigation effort [1][4].
The second pattern is change risk assessment. Before a planned change — a deployment, a configuration update, a scaling event — Concert evaluates the proposed change against the current state of the estate and produces a change risk score. This score reflects the blast radius of the change, the historical failure rate for similar changes to similar components, the current health of dependent services, and calendar factors such as whether the change falls within a high-traffic period or a regulatory quiet window. The workflow surfaces this score in the CI/CD pipeline or change management portal, enabling teams to decide whether to proceed, defer, or apply additional safeguards. This pattern is covered in detail in section 15.4.
The third pattern is capacity and cost optimisation. Concert maintains a continuous model of resource consumption, projected demand, and unit cost across the estate. When it identifies persistent underutilisation, projected capacity shortfall, or cost anomalies, it surfaces recommendations with supporting evidence: specific workloads, resource types, zones, and time windows. The workflow routes optimisation recommendations through the agent-assisted or human-initiated modes depending on the scale of the proposed change, and tracks the financial and operational impact of accepted versus declined recommendations over time, providing a feedback signal for the accuracy of Concert’s modelling [1][2].
The fourth pattern is proactive risk identification. This is Concert’s most analytically demanding workflow: scanning the estate for conditions that have not yet caused an incident but that historical data, topology analysis, and model-based reasoning suggest are likely to do so. A certificate approaching expiry that has not yet triggered an alert but will breach SLO thresholds within the planning horizon. A gradual memory leak whose current rate, if maintained, will exhaust available headroom before the next scheduled maintenance window. A dependency on a deprecated API version that is scheduled for removal in an upstream service update. Concert surfaces these findings with evidence and urgency scores, and routes them as scheduled recommendations into the team’s workflow rather than as reactive incidents. The distinction is meaningful: organisations that act on proactive recommendations are, by definition, managing risk rather than managing failures [3][5].
These four patterns are not mutually exclusive and they share infrastructure. The same ingestion pipeline, topology model, and recommendation engine underlies all four. The differentiation is in what analytical question is being asked and what action pathway is triggered by the answer.
15.3 Situation management
The situation is Concert’s primary unit of operational work. Understanding its lifecycle is essential for integrating Concert into existing operations workflows and for configuring the integrations — ITSM, notification, escalation — that depend on situation state transitions.
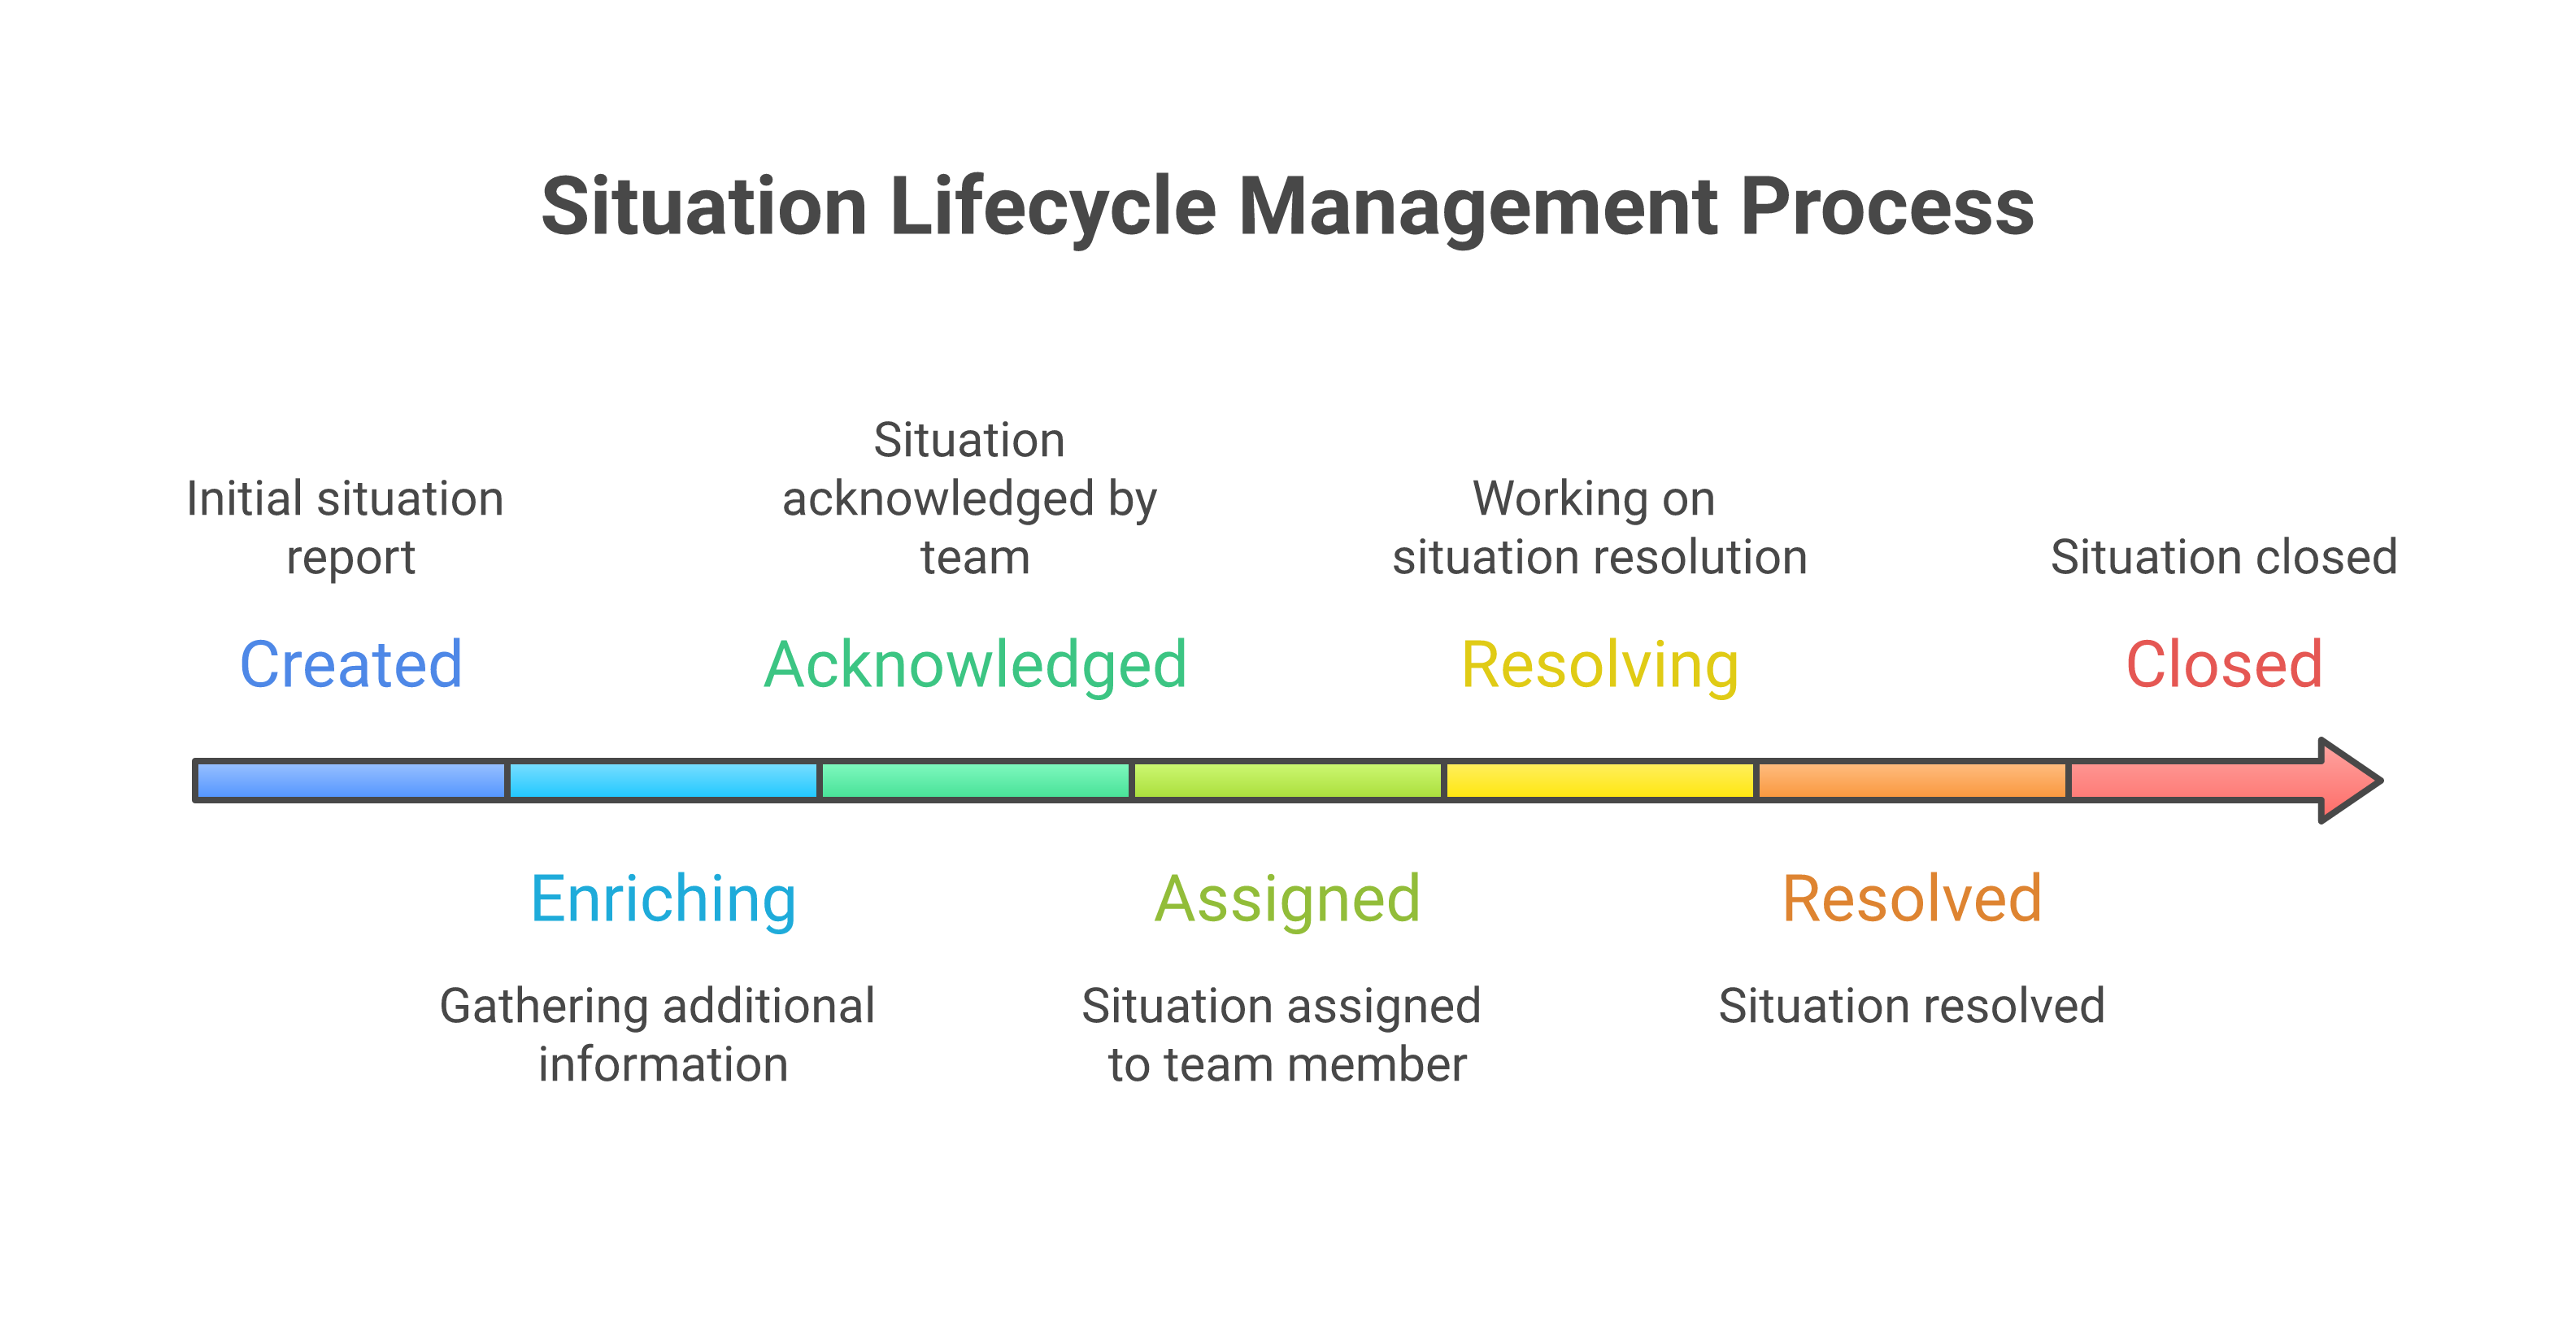
Creation begins when Concert’s correlation engine determines that a cluster of signals — alerts, anomaly detections, topology change events, or log patterns — is more likely to represent a single operational problem than a coincidence of unrelated events. The engine evaluates signal timing, topological proximity, semantic similarity of alert descriptions, and pattern matching against historical incidents before creating a situation. Early in a situation’s life, the evidence may be sparse; Concert creates the situation as soon as the probability of a genuine underlying fault exceeds a configurable threshold, rather than waiting for definitive evidence that might arrive too late for effective response [4].
Enrichment is the ongoing process by which Concert adds context to the situation as more signals arrive, as analysis completes, and as human operators contribute information. Enrichment sources include: additional correlated alerts that arrive after situation creation; topology traversal that identifies further affected or at-risk components; historical incident matching that surfaces runbooks and past resolution steps; change correlation that identifies recent deployments or configuration changes as potential causal factors; and human annotations from operators who have investigated the situation and can contribute findings that the automated analysis cannot access [1].
Severity is calculated dynamically throughout the situation’s life. Concert’s severity model considers the business impact of affected components — derived from the service tier and SLO definitions loaded into Concert’s topology model — the number and criticality of affected end users or transactions, the rate of signal arrival (a rapidly worsening situation warrants higher severity than a stable one), and any explicit severity escalations made by human operators who have visibility into context Concert cannot observe directly. Severity drives routing, notification, escalation timing, and the urgency of associated recommendations [1][4].
The situation timeline is a chronologically ordered record of every significant event in the situation’s life: signal arrivals, severity changes, enrichments, human interactions, recommendation generations, action executions, and state transitions. The timeline is both an operational tool — enabling an operator arriving mid-incident to reconstruct quickly what has happened — and an audit record. For regulated organisations, the timeline provides evidence that the incident response process was followed and that decisions were made by authorised individuals at documented times.
Human interaction with situations occurs through the Concert UI and via the Concert API. Through the UI, operators can acknowledge a situation (recording that it has been seen and accepted for action), assign it to a named individual or team, annotate it with findings or hypotheses, escalate its severity, link it to a parent situation if it is determined to be a component of a larger incident, and mark it as resolved when the underlying fault has been addressed. Each of these interactions is time-stamped and attributed to the authenticated user who performed it. The Concert API exposes the same operations programmatically, enabling integration with external tools and with agentic systems that operate on behalf of human teams. Resolution closes the active phase of the situation; closure, which may follow resolution after a configurable settling period during which Concert monitors for recurrence, marks the situation as complete and archives its timeline for retrospective analysis and model training [1].
15.4 Change risk intelligence
The relationship between change frequency and operational stability is one of the central findings of the DORA research programme. Forsgren, Humble, and Kim’s Accelerate [6] established that high-performing engineering organisations deploy more frequently and recover from failures faster than their peers — a finding that overturned the intuitive assumption that frequent change necessarily means higher risk. The mechanism is not that frequent change is inherently safe, but that organisations with mature delivery practices have shorter feedback loops, smaller change batches, and faster detection-to-recovery cycles that make individual failures less consequential.
Concert’s change risk intelligence is designed to operationalise this insight. Rather than treating all change as equally risky, or applying blanket deployment freezes during sensitive periods, Concert provides a per-change risk score that reflects the actual risk profile of the specific change in the specific context in which it will occur.
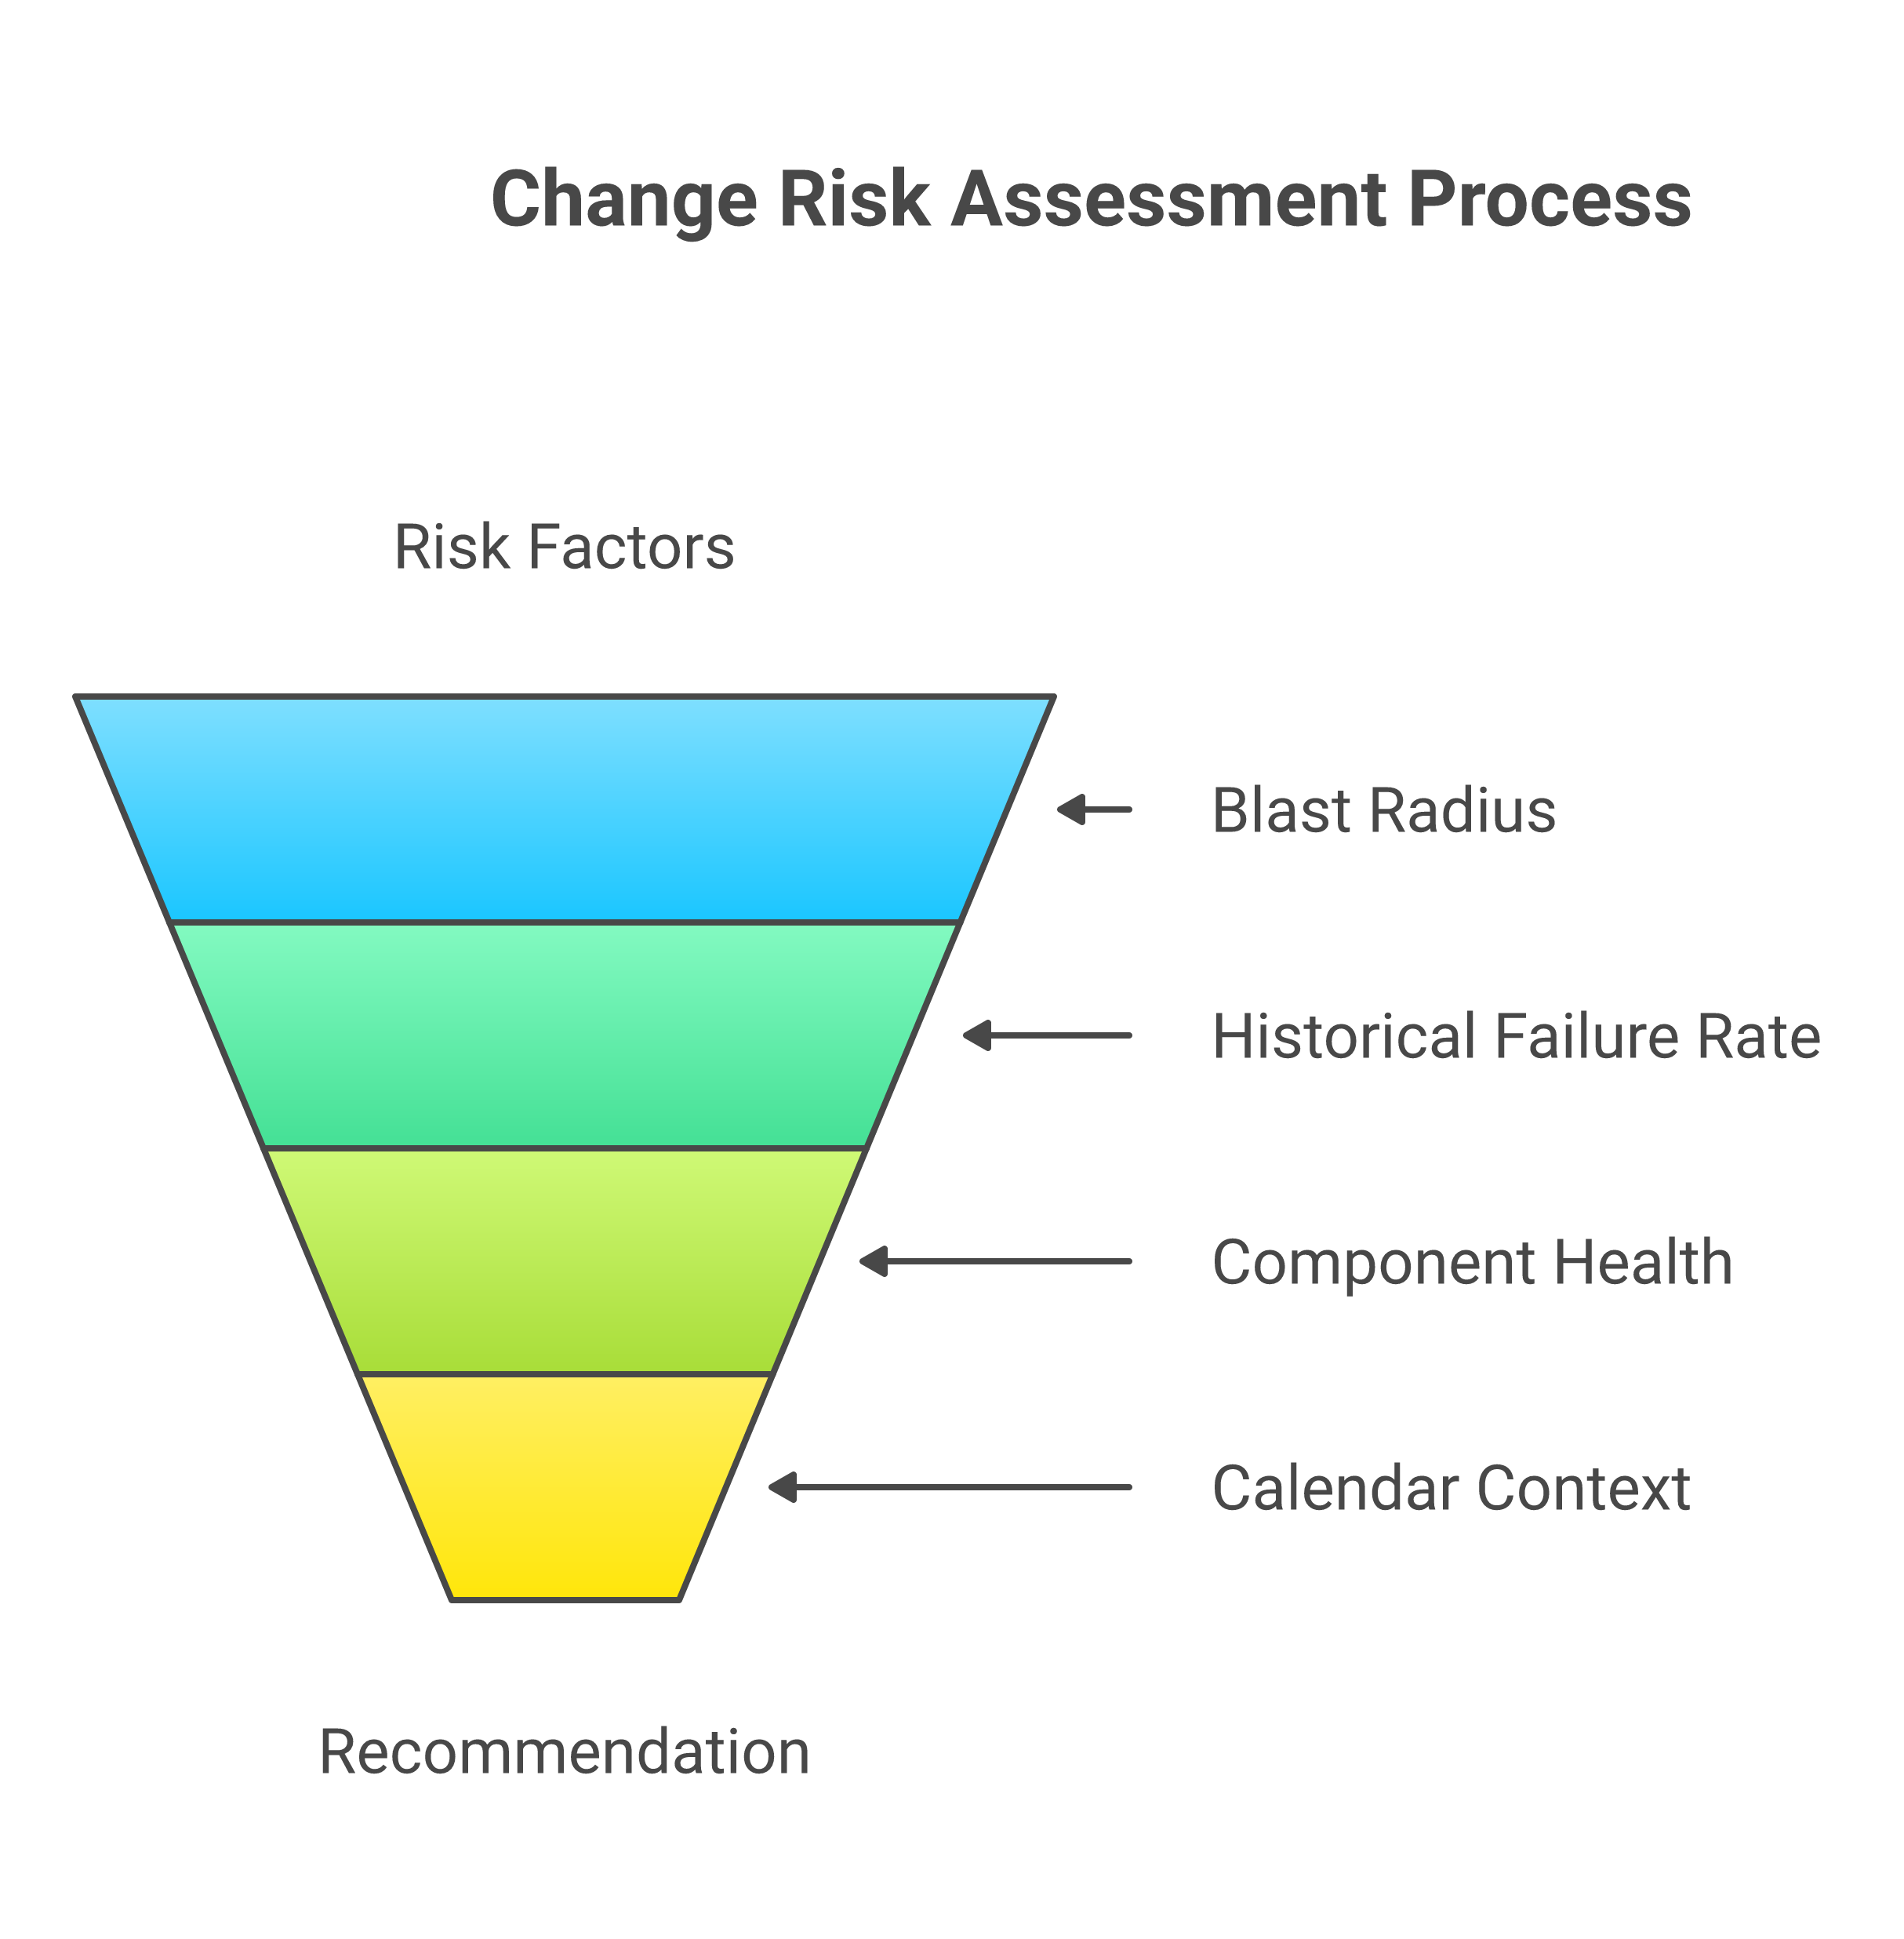
The change risk score is a composite metric derived from four primary factors. The first is blast radius: an estimate of the number of dependent services, consumers, and transactions that would be affected if the change failed. Concert derives blast radius from the topology model, traversing the dependency graph outward from the component being changed to identify downstream dependants. A change to a shared authentication service has a larger blast radius than a change to an isolated batch processing job, even if the deployment process is identical [1][7].
The second factor is historical change failure rate: the proportion of past changes to this component type, in this zone, by this team, that have resulted in incidents or rollbacks. Concert learns this rate from its own incident history and from data imported via ITSM integrations. A component with a high historical failure rate for changes of this type warrants a higher risk score regardless of the apparent simplicity of the current change. This is not a judgement on the team; it is a reflection of the operational reality that some components are more sensitive to perturbation than others, whether due to their own complexity, their dependencies, or the nature of the changes typically made to them [6][7].
The third factor is current component health: the Concert health score of the component being changed and its direct dependants at the time the change is evaluated. Deploying into a component that is already exhibiting elevated error rates, latency anomalies, or resource pressure is riskier than deploying into a healthy component, even if everything else is equal. A change that might proceed smoothly under normal conditions may tip a stressed system into failure. Concert’s dynamic evaluation means that risk scores are calculated at change time, not at planning time, and a change that received a low risk score during planning may be flagged for deferral if conditions deteriorate before the deployment window [1].
The fourth factor is time-of-day and calendar context: whether the change falls within a period of elevated traffic, a regulatory quiet window, a known maintenance window, or an organisational risk-sensitivity period such as a financial quarter-end or a major product launch. Concert ingests calendar data — from ITSM change management, from operational runbooks, and from explicit configuration — and uses it to adjust risk scores. A change that carries a moderate risk score at 03:00 on a Tuesday may carry a significantly higher score at 09:00 on the Monday before a major release [7].
CI/CD pipeline integration brings change risk scoring into the delivery workflow before a human reviewer or a change advisory board sees the change request. Concert exposes a change risk API that can be called from pipeline stages in Jenkins, Tekton, GitHub Actions, or any CI/CD system that supports webhook or API integration [1][8]. The pipeline passes change metadata — the component being changed, the type of change, the target zone, the proposed deployment time — and receives back a risk score and a recommended disposition: proceed, proceed with conditions (such as additional monitoring, a short deployment window, or a manual approval step), or defer. Organisations can configure the pipeline to enforce these dispositions as hard gates, or to surface them as advisory information for the human approver.
This integration creates a feedback mechanism that is absent in traditional change management: the delivery pipeline, the risk scoring system, and the incident record are connected. When a change proceeds and causes an incident, that outcome updates Concert’s historical failure rate model for future scoring. When a high-risk change is deferred and the conditions that elevated the risk score subsequently resolve, the pipeline can be re-triggered with an updated score that reflects the improved conditions. The risk model is not static configuration; it is a continuously learning system [3][5].
The deployment frequency and MTTR trade-off deserves explicit attention. Concert’s change risk scoring is sometimes misread as a mechanism for slowing change — if the system flags risk, teams will defer, and deployment frequency will fall. This is a valid concern, and it is worth being direct about how Concert is designed to avoid it.
Concert’s scoring is calibrated to distinguish genuine risk from mere unfamiliarity. A team deploying frequently to a well-tested, well-monitored component will build a strong historical record of low failure rates, and Concert’s scores will reflect this: frequent, low-risk changes by experienced teams to healthy components will consistently score low and proceed without friction. The system applies friction selectively, to the changes where the evidence actually supports elevated risk [6][7]. The goal is not to make change harder; it is to make risk visible so that teams can make informed decisions about when and how to proceed.
In organisations with mature practices, the experience of Concert’s change risk scoring is often that it validates existing intuitions — experienced engineers already know which systems are most sensitive to change — but does so with evidence that can be communicated to stakeholders outside the team and used to justify investment in reducing underlying fragility.
15.5 Integration with ITSM
IT service management platforms and AIOps systems have historically coexisted uneasily. ITSM platforms such as ServiceNow and Jira Service Management are systems of record for incidents, changes, and problems, with well-established workflows and governance structures. AIOps systems detect and correlate events at a speed and volume that ITSM workflows were not designed to absorb. The result, in many organisations, has been a proliferation of alerts that never reach the ITSM system, an ITSM incident record that bears only a partial relationship to operational reality, and an audit trail that is incomplete.
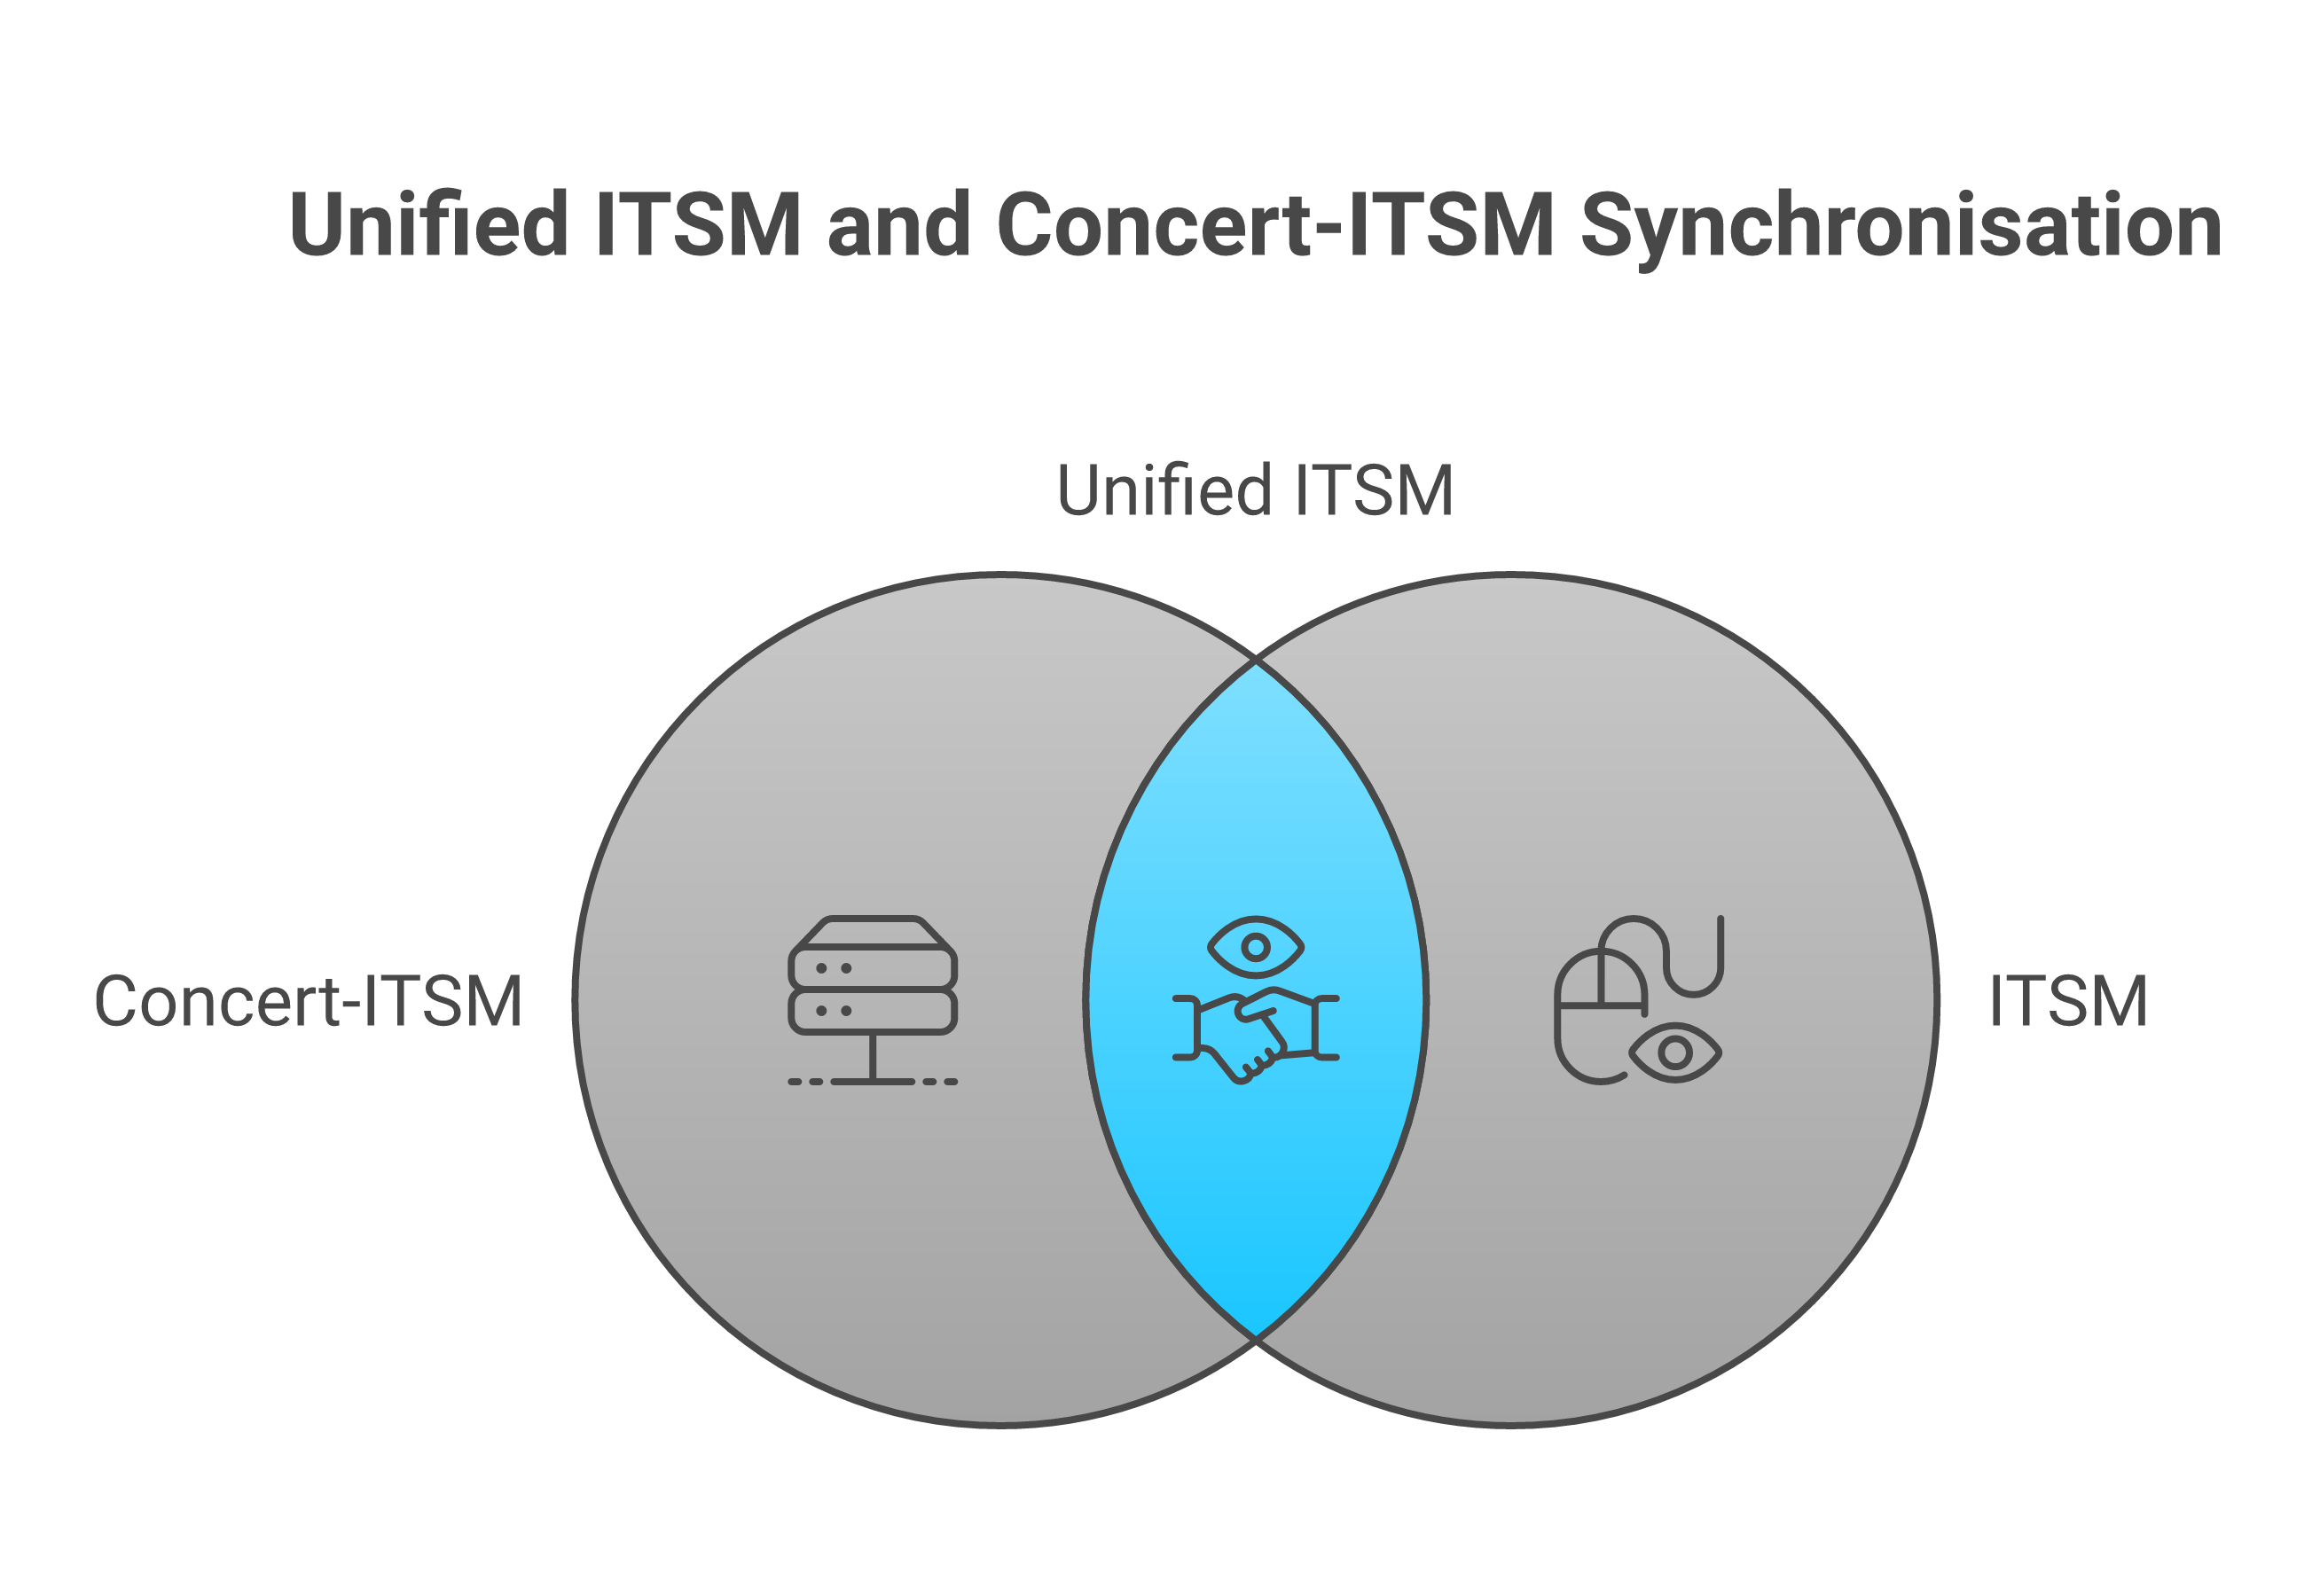
Concert addresses this through bi-directional synchronisation with ITSM platforms. The integration is not a one-way feed of alerts into ticket queues; it is a genuine synchronisation in which state changes in either system are reflected in the other.
When Concert creates a situation above a configured severity threshold, it automatically creates a corresponding incident in the ITSM platform, populating it with the situation summary, affected components, severity, and a link back to the Concert situation timeline [1]. As the situation is enriched, the ITSM incident is updated: new affected components are added, severity changes are reflected, and Concert-generated recommendations are attached as work notes. When an operator in the ITSM platform updates the incident — reassigning it, adding investigation notes, or marking it resolved — those updates are reflected back in Concert, attributed to the operator and time-stamped [9].
The same bidirectionality applies to change requests. Concert’s change risk assessment can be triggered from a ServiceNow change request, with the risk score and recommendation written back into the change record. When a change request is approved through the ITSM change advisory process, Concert is notified and updates its change calendar, which feeds into subsequent risk scoring for changes scheduled in proximity to the approved change. This creates an integrated change management picture that was previously only achievable through manual cross-referencing between systems [7][9].
CAB automation for low-risk changes is one of the more operationally significant applications of Concert-ITSM integration. Traditional Change Advisory Board processes impose a review overhead that is appropriate for significant or high-risk changes but disproportionate for routine, well-understood, low-risk changes. Concert can automate CAB approval for changes that fall below a configurable risk threshold and belong to pre-approved change categories. The automation creates the change record, attaches the Concert risk score and evidence, confirms that all pre-conditions are met, and transitions the change to approved status without convening a human panel. Human CAB review is reserved for changes above the threshold, which receive a richer evidence package from Concert than a traditional CAB would typically have available [7][10].
Audit trail for regulatory traceability is a non-negotiable requirement in regulated environments. Concert’s ITSM integration ensures that every operational action — whether human-initiated or automated — is reflected in the ITSM system of record with a complete evidence trail: what was detected, what was recommended, what was approved, by whom, when, and what was executed. This trail is maintained in a form that can be exported to regulatory reporting formats and is protected from retrospective modification. For organisations subject to frameworks such as DORA, FCA SYSC, or ISO 27001, this integrated audit trail significantly reduces the manual effort required to demonstrate operational governance compliance [10][11].
15.6 Runbook and automation integration
A recommendation that Concert cannot connect to an executable action is a recommendation that an operator must translate into manual steps. In a well-instrumented estate, that translation overhead accumulates into a significant portion of operational effort, and it introduces variability — different operators translating the same recommendation into slightly different steps, with different outcomes and different levels of documentation. Concert’s runbook and automation integration is designed to reduce this overhead while preserving the governance controls that make automation safe in regulated environments.
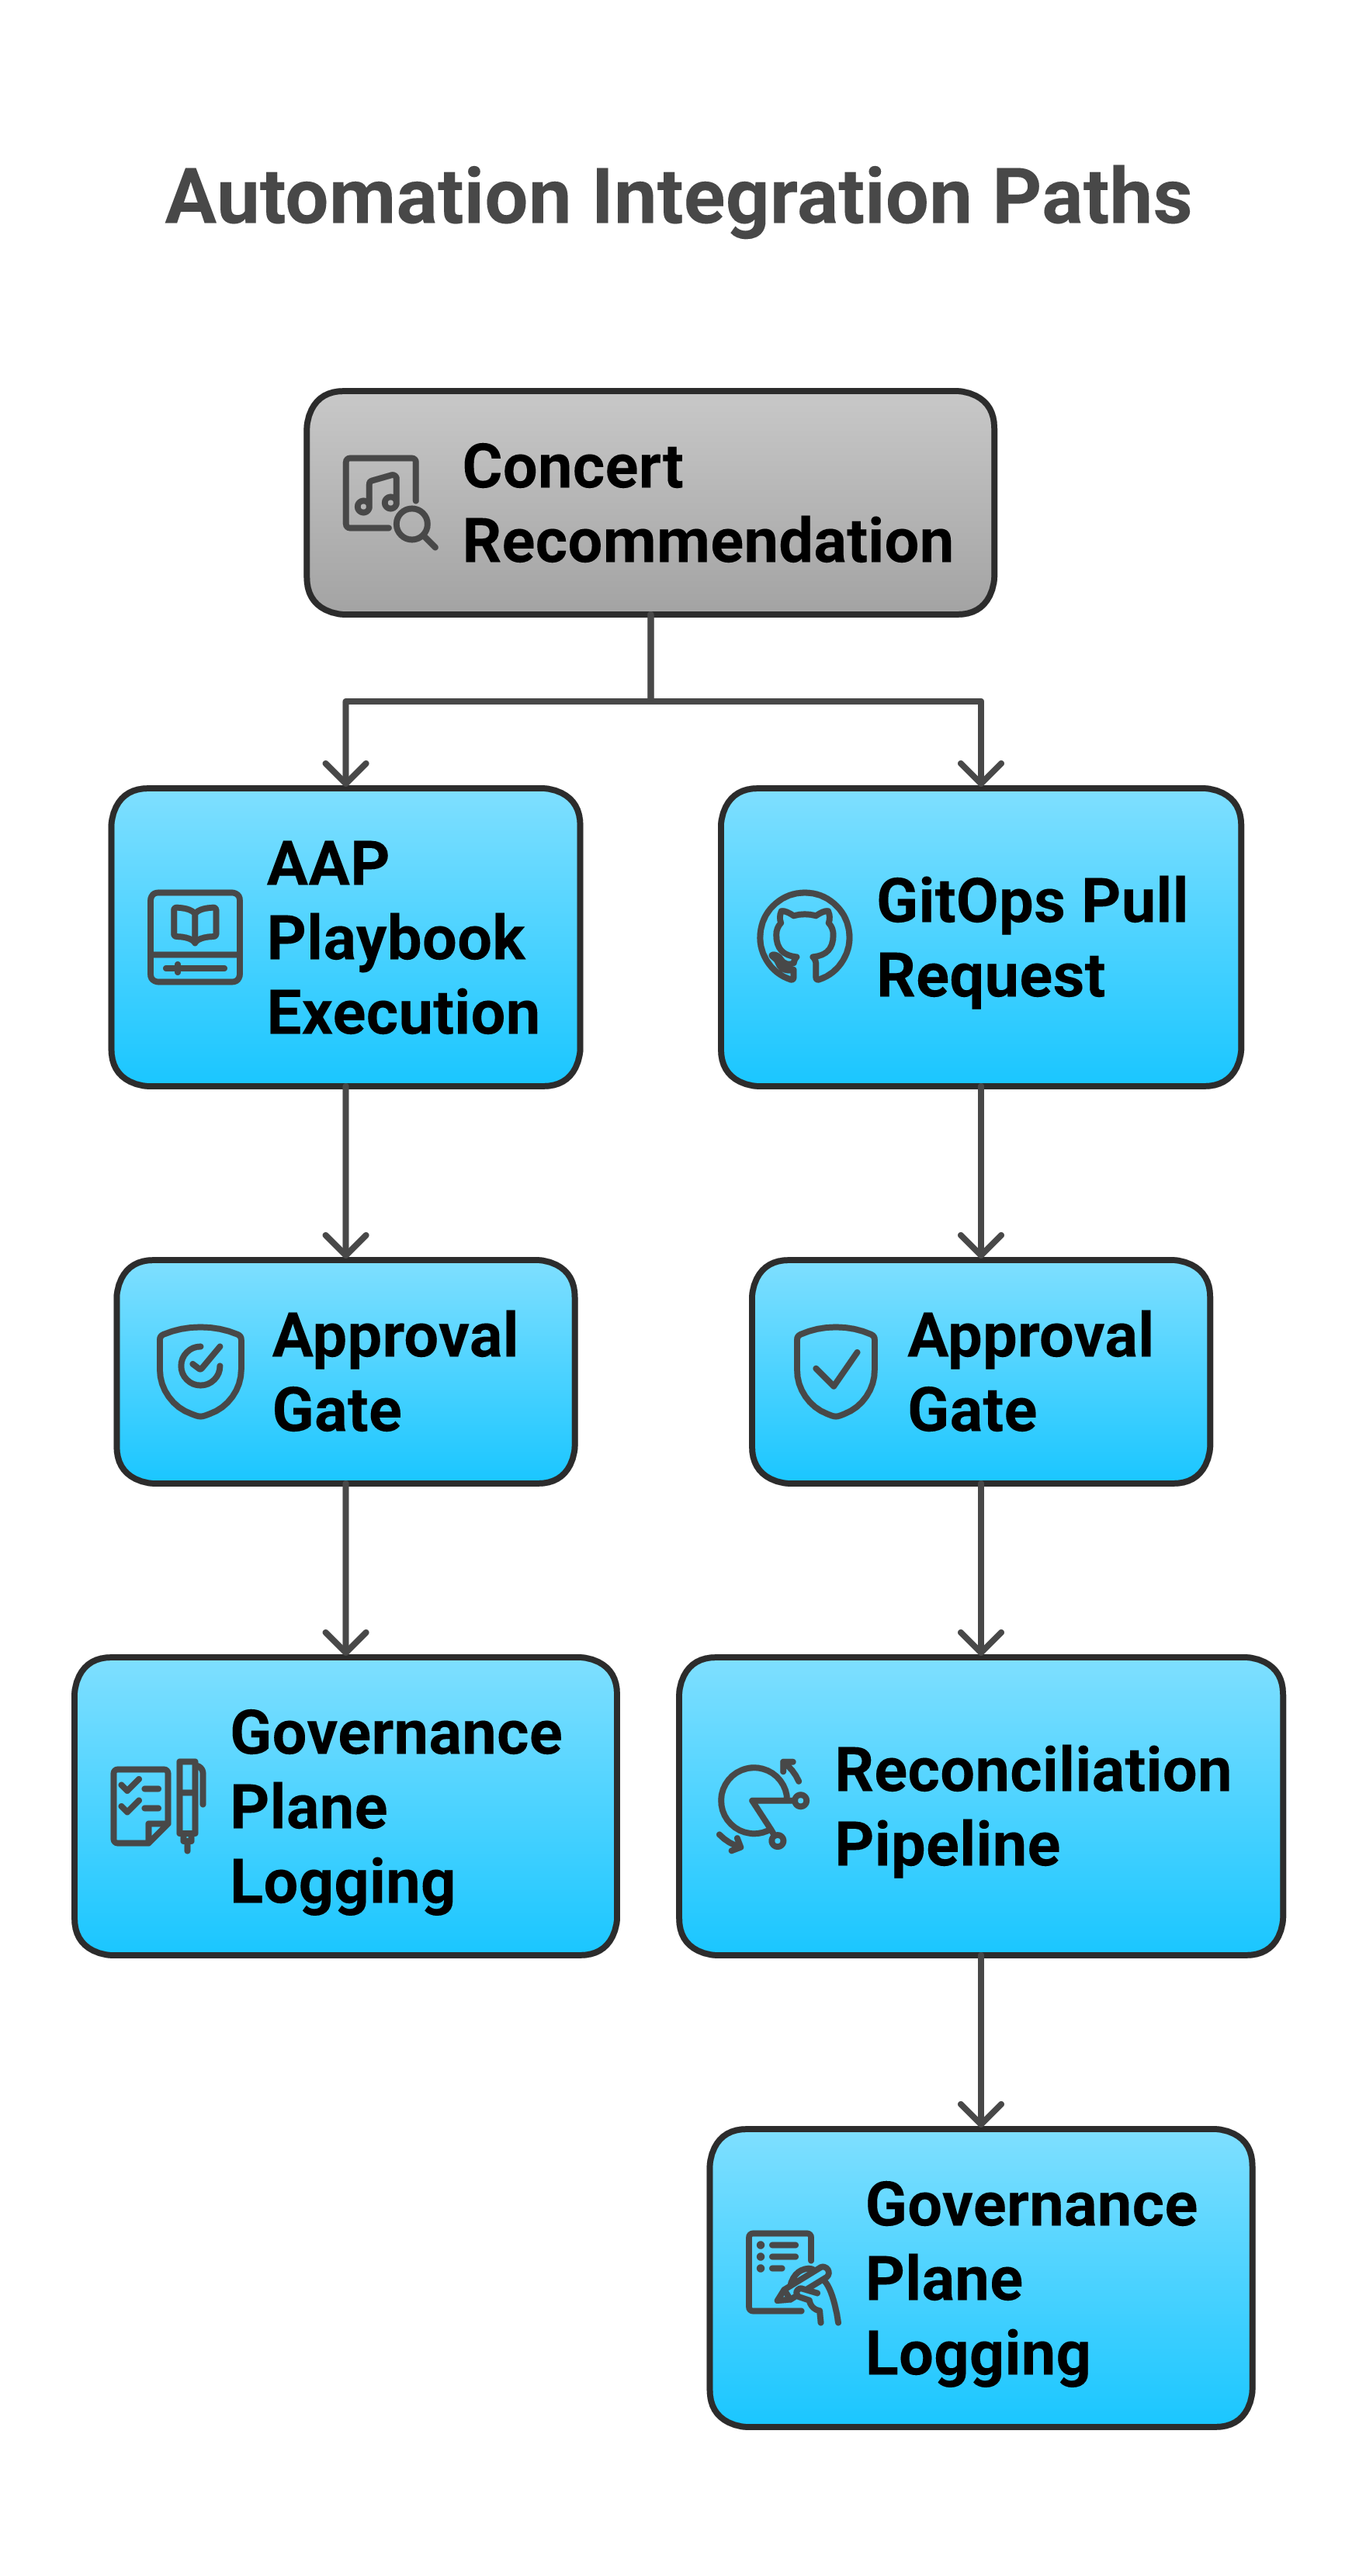
The primary automation integration path is Concert recommendations triggering Ansible playbooks via IBM Ansible Automation Platform (AAP) [1][12]. The integration works as follows: Concert identifies a recommendation for which an associated Ansible playbook has been registered in AAP, constructs a job template invocation with the specific parameters derived from the situation context — the affected hosts, the recommended action type, the target state — and either submits it for human approval (in agent-assisted mode) or executes it directly (in automated mode, for pre-approved categories). AAP returns the execution status and any output artifacts back to Concert, which attaches them to the situation timeline. If the playbook execution does not achieve the expected outcome, Concert detects the discrepancy and escalates to human review.
This architecture separates the concerns cleanly. Concert provides the intelligence: what needs to be done, why, and to which components. AAP provides the execution capability: the playbooks that know how to make the change safely, with idempotency guarantees and error handling built in. Operators contribute the authorisation: the decision that a specific action, in a specific context, is acceptable to execute now. No single layer attempts to perform all three functions, and the boundaries between them are explicit and auditable [1][12].
GitOps integration provides a second path, particularly suited to infrastructure and configuration changes that are best expressed as code rather than as imperative commands. When Concert identifies a recommendation that corresponds to a configuration change — a resource limit that should be adjusted, a policy that should be updated, a replica count that should be modified — it can generate a pull request in the organisation’s GitOps repository, populated with the proposed change and annotated with the Concert situation reference, the risk score, and the evidence that motivated the recommendation [1]. The pull request enters the normal GitOps review process: it is reviewed by a human approver, validated by automated policy checks, and merged when approved. The merge triggers the GitOps reconciliation pipeline, which applies the change to the target environment and reports the outcome.
This approach has several advantages in a regulated environment. The change is expressed as a code diff in a version-controlled repository, providing a permanent, immutable record of what was changed, why, and who approved it. The review and approval process follows established software engineering practices rather than ad hoc incident response procedures. The GitOps pipeline applies the change consistently and idempotently, reducing the risk of manual execution errors. And the connection between the Concert situation and the specific commit that resolved it is preserved in both directions — from the Concert timeline to the Git history and from the Git commit message to the Concert situation identifier.
Human approval gates are present in both the Ansible and GitOps paths, and their presence is not optional for actions above the automated threshold. The architecture is designed so that removing approval gates requires an explicit configuration change that is itself subject to governance controls, rather than a default that can be bypassed under operational pressure. This reflects a design principle articulated in the ITIL 4 framework [10]: that automation should accelerate human decisions, not replace the decision-making accountability that governance requires.
Every automation execution — whether triggered by Concert directly via AAP or via a GitOps merge — is tied to an authorisation event that is logged to the Governance Plane. The authorisation event captures the identity of the approver (human operator or, for pre-approved categories, the automated policy that authorised the action), the Concert recommendation that motivated the action, the risk score at the time of authorisation, and the playbook or change commit that was executed. This log is the operational equivalent of a signed authority record: it enables retrospective audit of who authorised what, under what circumstances, and with what supporting evidence. In a regulatory examination, these records provide the evidence base for demonstrating that automated operations were subject to appropriate governance, not merely assumed to be so [10][11].
15.7 Concert dashboards and the operations experience
Before integrated AIOps platforms, operations centres relied on a landscape of monitoring dashboards — one per tool, one per team, one per service tier. A practised operator could navigate this landscape efficiently, but the cognitive overhead of maintaining context across dozens of views was significant, and operators new to a system faced a steep learning curve. More critically, no single dashboard showed the relationship between signals across different layers of the stack: a memory alert from the infrastructure dashboard was disconnected from the latency spike on the application performance management dashboard and the error rate on the service mesh dashboard, even when all three were symptoms of the same underlying fault.
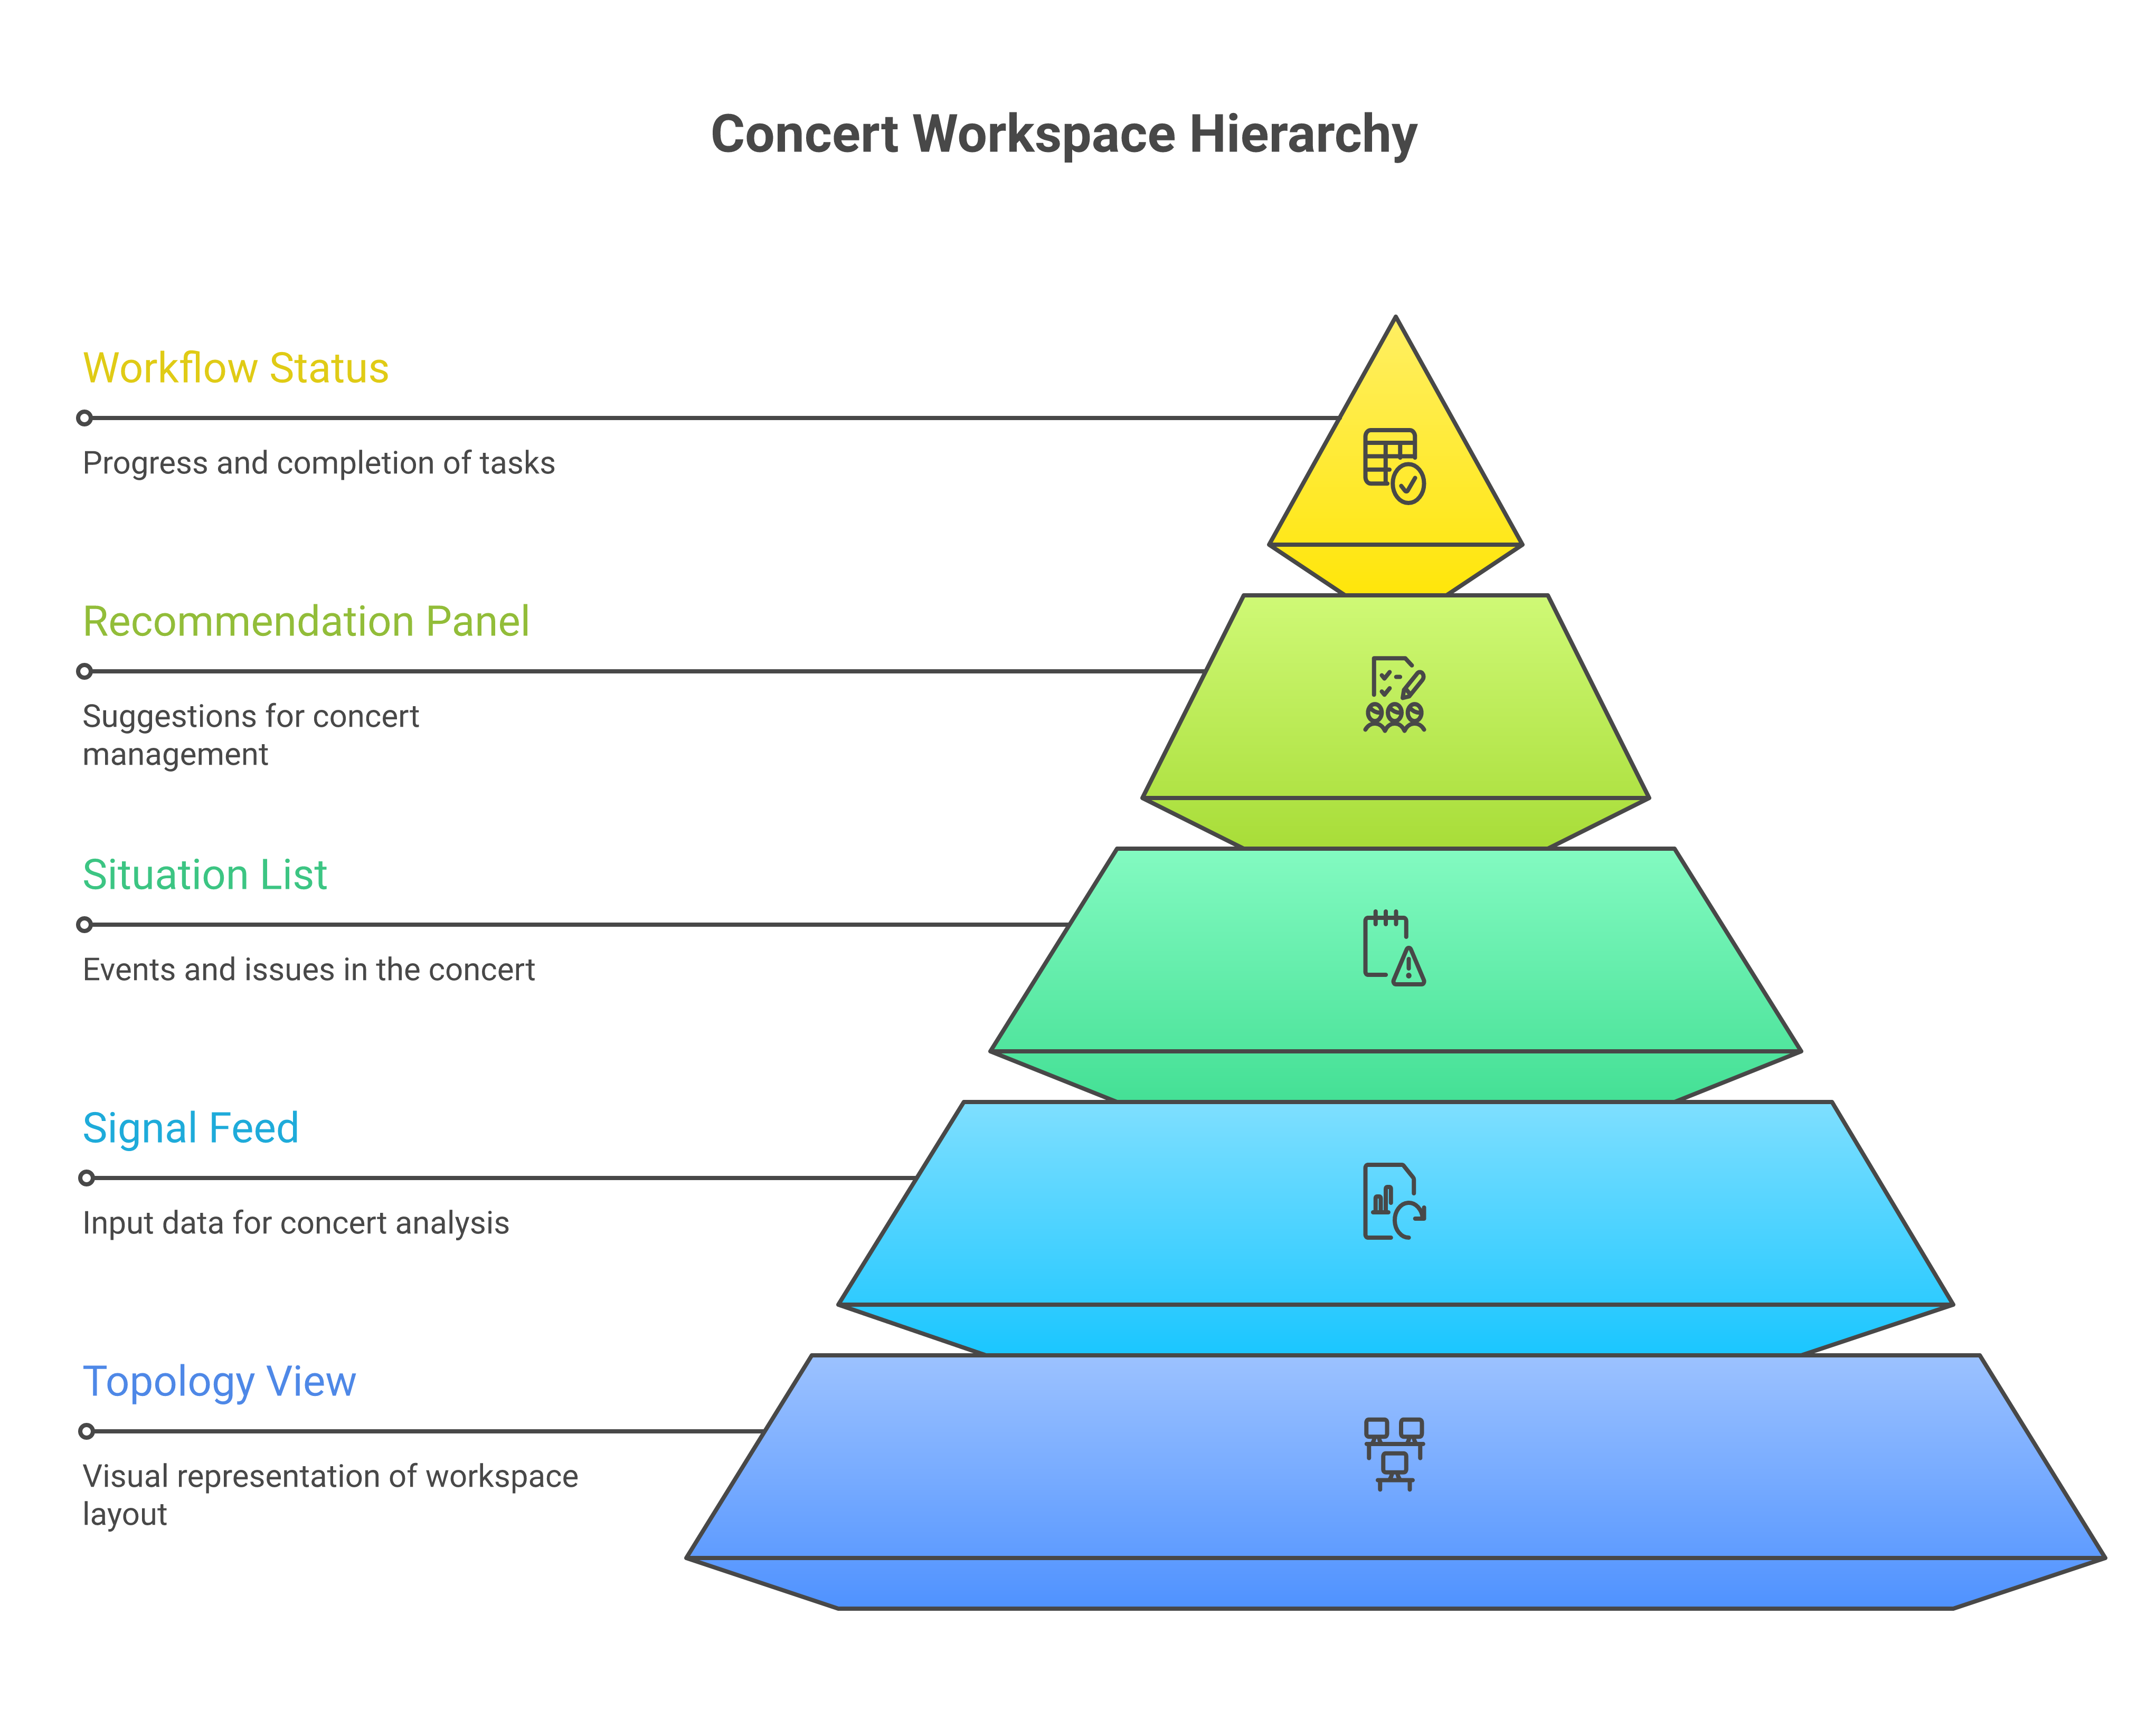
Concert’s workspace is designed to replace this dashboard landscape with a unified operational view. The workspace comprises five primary components that together provide the context an operator needs to understand, investigate, and act on operational situations without leaving the Concert interface.
The topology view displays the live dependency graph of the application estate, with components coloured according to their current Concert health score. This is not a static architecture diagram; it is a live representation of the estate as Concert understands it, updated continuously as health scores change and as topology discovery identifies additions or removals of components. The topology view supports navigation: selecting a component reveals its signal feed, its health history, its associated situations, and its recent changes. Operators use the topology view to understand blast radius — visually tracing which components depend on a component that is currently degraded — and to contextualise signals that might otherwise appear unrelated [1].
The signal feed provides a chronologically ordered stream of significant events: alert arrivals, anomaly detections, topology changes, situation creations, severity changes, and action completions. The signal feed is the Concert equivalent of a syslog in that it captures everything of significance, but it differs from a raw log in that events are correlated, annotated, and linked to the situations and components they affect. The feed supports filtering by time window, component, situation, and signal type, enabling operators to reconstruct event sequences during investigation without needing access to the raw log stores.
The situation list is the primary triage interface. Situations are displayed in priority order, with severity, affected components, duration, assigned owner, and current recommendation status visible at a glance. Colour coding and icon conventions make it possible to assess the operational picture in seconds. The situation list respects the operator’s access permissions: users with access to only a subset of zones, services, or teams see only the situations relevant to their scope, and the priority ordering reflects business impact within their scope rather than absolute severity across the estate.
The recommendation panel displays Concert’s current recommendations, grouped by situation and ranked by urgency and potential impact. Each recommendation shows the evidence that supports it, the proposed action, the risk classification, and the available response pathways — human-initiated, agent-assisted, or automated. Operators can act on recommendations directly from the panel, invoking the Orchestrate elaboration workflow or triggering automated execution for pre-approved categories. Accepted and declined recommendations are recorded, and the recommendation panel tracks the resolution status of accepted recommendations, closing them when Concert confirms that the recommended action has achieved the desired effect.
The workflow status panel provides visibility into active automation: Ansible job executions, GitOps pull requests awaiting merge, pending approval gates, and recently completed actions with their outcomes. This panel is the operational equivalent of a pipeline dashboard and is essential for operators who need to understand not just what Concert has recommended but what is currently happening in the automation layer as a consequence of previous decisions.
Zone, jurisdiction, and service-tier filtering is available across all workspace components. In a sovereign cloud estate that spans multiple regulatory zones, this filtering is operationally essential: an operator responsible for the EU zone must be able to focus on the situations, signals, and recommendations relevant to that zone without being overwhelmed by signals from other zones, while a global operations manager needs a cross-zone view for escalation and trend analysis. Filtering is applied consistently across the workspace — selecting a zone in the topology view applies the same zone filter to the signal feed, situation list, and recommendation panel — so that the operator maintains a coherent picture across components.
RBAC in Concert governs not just which situations and recommendations an operator can see but which actions they can take. The role model distinguishes between observers (read-only access to the Concert workspace), operators (can acknowledge, annotate, and assign situations; can initiate human-mode actions), senior operators (can approve agent-assisted execution plans), and administrators (can configure Concert settings, manage integrations, and modify risk classification rules). Roles are assigned per zone, per service tier, or globally, enabling fine-grained access control that reflects organisational structure and regulatory separation requirements [1][11].
15.8 Measuring Concert’s operational impact
Deploying Concert without measuring its impact is both operationally irresponsible and strategically unwise. Operationally, measurement identifies where the system is performing well and where it requires tuning — where false positives are eroding operator trust, where recommendations are not being acted on, where the risk model is miscalibrated. Strategically, measurement provides the evidence base for the ongoing investment that Concert deployment requires and for the governance conversations about expanding automation scope that will arise as the system matures.
Five metrics provide the core measurement framework.
Recommendation acceptance rate is the proportion of Concert recommendations that are acted on by operators, expressed as a fraction of all recommendations surfaced. A high acceptance rate indicates that recommendations are relevant, timely, and actionable. A declining acceptance rate is an early warning that recommendation quality is degrading — perhaps because a new data source has introduced noise, because the topology model has drifted from operational reality, or because operator trust has been eroded by a sequence of poor recommendations. Acceptance rate should be tracked by recommendation category to identify which types of recommendation are most and least trusted [3][5].
Mean time from situation creation to resolution is the primary measure of Concert’s impact on incident response speed. It is measured from the timestamp of situation creation to the timestamp of situation resolution, and it should be trended over time and segmented by severity, service tier, and zone. Reductions in this metric indicate that Concert’s correlation and triage capabilities are reducing investigation overhead and accelerating remediation. Organisations that have deployed Concert have reported meaningful reductions in this metric as operators shift from alert-by-alert investigation to situation-level engagement [1][4].
Change failure rate trend measures the proportion of deployed changes that result in incidents or rollbacks over time. This metric predates Concert and is one of the four key DORA metrics [6][7]; Concert’s contribution is to enable its active management rather than passive tracking. As Concert’s change risk scoring becomes integrated into deployment pipelines and as teams act on high-risk change deferrals, the change failure rate should trend downward. Monitoring this trend provides direct evidence of Concert’s impact on delivery reliability.
False positive rate measures the proportion of Concert situations that, on investigation, turn out not to represent genuine operational problems. False positives are expensive: they consume operator attention, erode trust in the system, and, if Concert is configured to create ITSM incidents automatically, pollute the incident record. A false positive rate above roughly 10–15% is typically a signal that the correlation engine requires tuning, that alert quality from a specific source has degraded, or that the topology model is inaccurate [3][4]. This metric should be captured through operator feedback — a simple resolution categorisation that includes “false positive” as an option — rather than inferred from other signals.
Operator escalation rate measures how often automated or agent-assisted actions are escalated by human operators to a different response mode — typically from automated to human-initiated — after Concert has recommended or initiated them. A high escalation rate suggests that the automated response mode is being applied to action categories that operators do not yet trust to execute without review, which may indicate that the risk classification thresholds are set too aggressively, that the playbooks require refinement, or that operators need additional information to build confidence in automated execution. Escalation rate is not intrinsically bad — human oversight is a feature, not a failure — but trends in escalation rate are informative about the evolution of operator trust and system maturity [5][11].
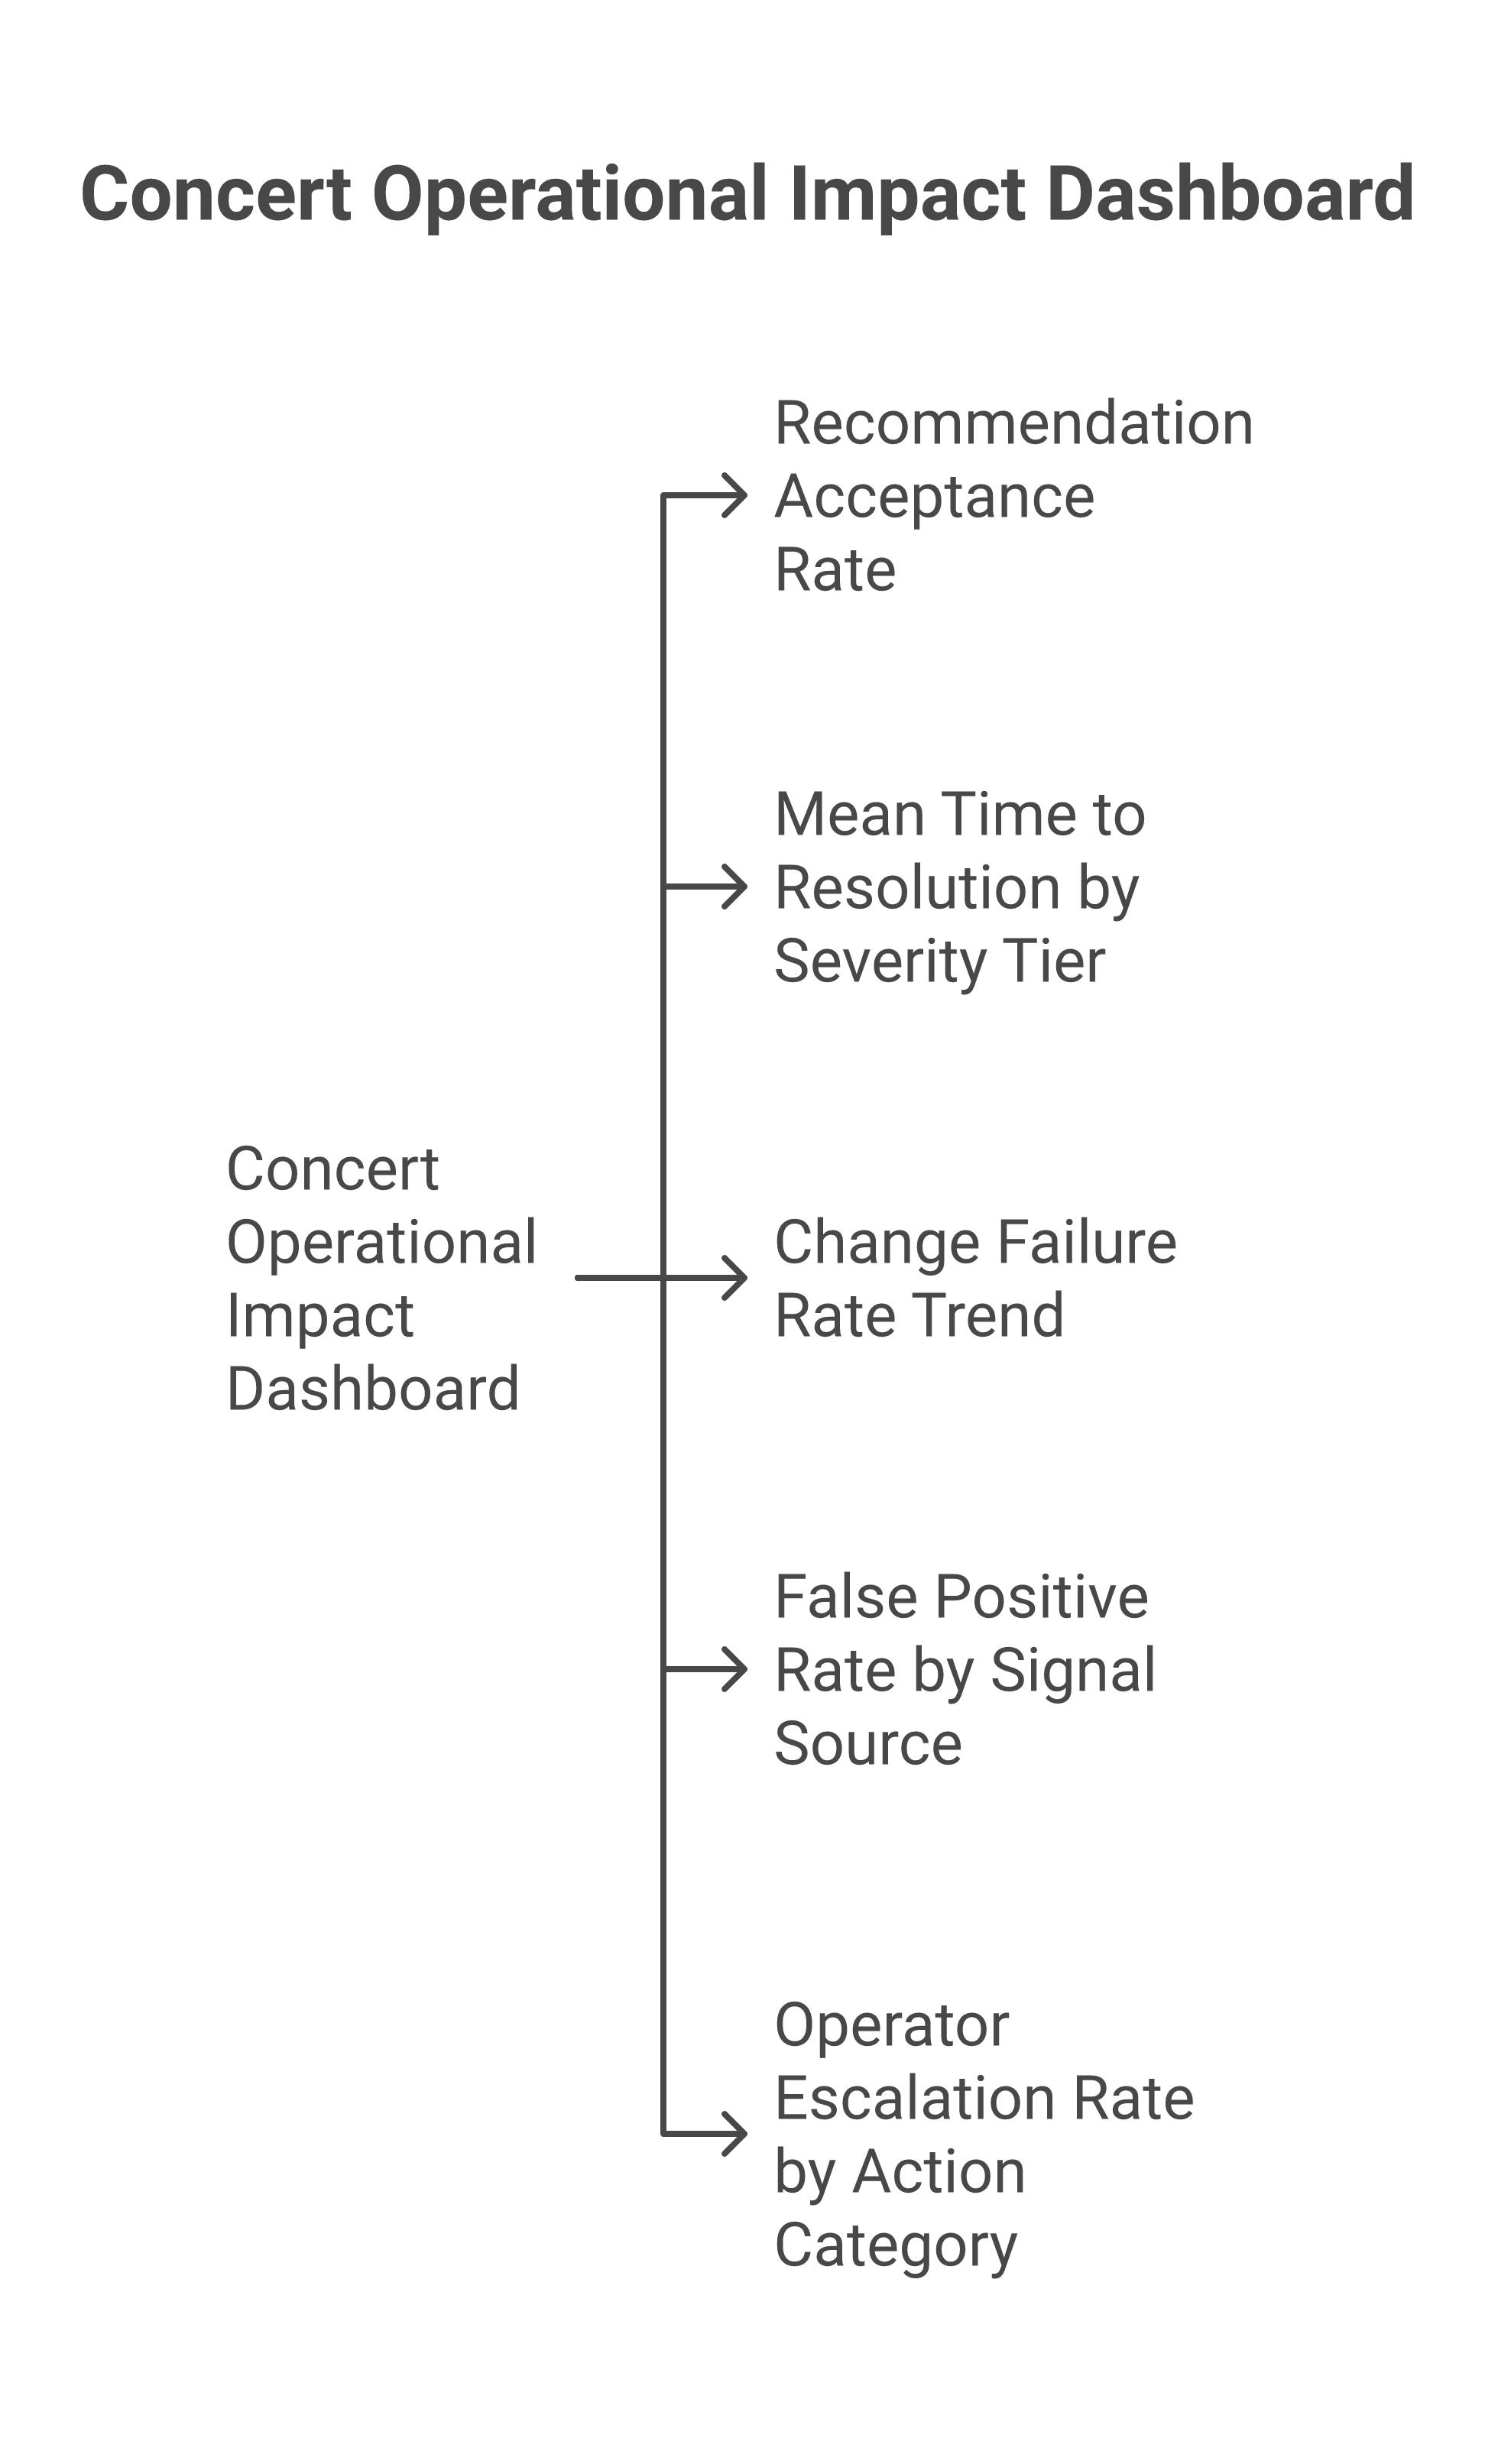
These five metrics do not operate in isolation. A drop in recommendation acceptance rate alongside a rise in false positive rate points to a data quality or model calibration problem. A reduction in mean time to resolution alongside a stable false positive rate is evidence of genuine performance improvement. A rising operator escalation rate in newly automated action categories, declining over several weeks as operators gain confidence, is a normal and healthy pattern in a maturing Concert deployment. Reading the metrics together, in context, is the skill that distinguishes operational excellence from operational measurement theatre.
Key Takeaways
-
Concert operationalises its intelligence through three response modes — human-initiated, agent-assisted, and automated — with the applicable mode determined by action risk classification that reflects blast radius, reversibility, historical failure rate, and current system health.
-
The four canonical AIOps workflow patterns — incident correlation and triage, change risk assessment, capacity and cost optimisation, and proactive risk identification — address distinct operational challenges but share a common Concert data and analysis infrastructure.
-
The situation lifecycle — from creation through enrichment, acknowledgement, resolution, and closure — is the primary unit of operational engagement, replacing alert-by-alert investigation with a unified, evidence-rich representation of underlying faults.
-
Concert’s change risk score is a composite of blast radius, historical change failure rate, current component health, and calendar context, and it is evaluated dynamically at change time rather than set statically at planning time; its integration into CI/CD pipelines creates a feedback loop between deployment outcomes and future risk scoring.
-
ITSM integration provides bidirectional synchronisation between Concert situations and incident records, between change risk scores and change requests, and between automated actions and the audit trail that regulatory traceability demands.
-
Runbook and automation integration via IBM Ansible Automation Platform and GitOps pull requests operationalises Concert recommendations as executable, auditable actions, with human approval gates architecturally enforced for all actions above the automated risk threshold and every execution tied to an authorisation event logged to the Governance Plane.
-
Measuring Concert’s impact through recommendation acceptance rate, mean time to resolution, change failure rate trend, false positive rate, and operator escalation rate provides the feedback required to tune the system, maintain operator trust, and build the evidence base for expanding automation scope responsibly.
Bridge to Chapter 16 — DevOps Insights and Change Risk
Concert’s change risk intelligence does not emerge from a vacuum. The historical change failure rates that feed the risk score, the deployment frequency data that contextualises it, and the release patterns that determine when the highest-risk deployments cluster in the calendar — all of this depends on Concert having access to a coherent picture of what is being delivered, by whom, at what pace, and with what outcomes. That picture is the subject of IBM DevOps Insights.
DevOps Insights sits at the intersection of the delivery pipeline and operational observability. It aggregates data from build systems, test frameworks, deployment tools, and incident records to produce a quality and risk profile for each delivery stream — a profile that Concert can consume to sharpen its change risk scoring and that engineering leaders can use to understand where their delivery practices are introducing operational risk. If Concert is the system that manages risk at deployment time and in production, DevOps Insights is the system that makes risk visible across the delivery lifecycle, from the first commit to the last deployment. Chapter 16 examines how these two capabilities connect, how DevOps Insights is configured to feed Concert’s risk model, and how the combination enables an evidence-based conversation about delivery quality that spans the gap between engineering and operations.
References
[1] IBM Corporation, IBM Concert Documentation, IBM Cloud Docs, 2024. [Online]. Available: https://www.ibm.com/docs/en/concert
[2] IBM Corporation, IBM Concert: AIOps Capabilities and Integration Guide, IBM Technical White Paper, 2024. [Online]. Available: https://www.ibm.com/products/concert
[3] A. Dabhade, B. Viswanath, and K. Rish, “AIOps: Real-World Challenges and Research Innovations,” IEEE Intelligent Systems, vol. 37, no. 2, pp. 59–66, Mar.–Apr. 2022. [Online]. Available: https://doi.org/10.1109/MIS.2022.3159764
[4] D. Zhu, P. Liu, and X. Su, “Hybrid Event Correlation for Cloud Incident Management,” IEEE Transactions on Network and Service Management, vol. 20, no. 1, pp. 412–427, Mar. 2023. [Online]. Available: https://doi.org/10.1109/TNSM.2022.3216560
[5] IBM Research, Towards AIOps at Scale: Lessons from Production Deployments, IBM Research Technical Report RJ-10572, Yorktown Heights, NY, 2023. [Online]. Available: https://research.ibm.com/topics/aiops
[6] N. Forsgren, J. Humble, and G. Kim, Accelerate: The Science of Lean Software and DevOps, IT Revolution Press, Portland, OR, 2018. [Online]. Available: https://itrevolution.com/product/accelerate/
[7] DORA (DevOps Research and Assessment), Accelerate State of DevOps Report 2022, Google LLC, Mountain View, CA, 2022. [Online]. Available: https://dora.dev/research/2022/dora-report/
[8] IBM Corporation, IBM Ansible Automation Platform Documentation, Red Hat and IBM, 2024. [Online]. Available: https://www.ibm.com/products/ansible-automation-platform
[9] ServiceNow, Inc., ServiceNow IT Operations Management: AIOps Integration Guide, ServiceNow Developer Documentation, Santa Clara, CA, 2024. [Online]. Available: https://docs.servicenow.com/bundle/washingtondc-it-operations-management/page/product/it-operations-management/concept/it-operations-management.html
[10] AXELOS, ITIL 4 Foundation: ITIL 4 Edition, The Stationery Office, London, 2019. [Online]. Available: https://www.axelos.com/certifications/itil-service-management
[11] IBM Corporation, IBM Concert Security and Compliance Guide: Role-Based Access Control and Audit Logging, IBM Cloud Docs, 2024. [Online]. Available: https://www.ibm.com/docs/en/concert
[12] Red Hat, Inc., Red Hat Ansible Automation Platform: Integration with Event-Driven Automation, Red Hat Documentation, Raleigh, NC, 2024. [Online]. Available: https://docs.redhat.com/en/documentation/red_hat_ansible_automation_platform
Sovereign Cloud Operations: AI-Driven Management of Sovereign Estates
© 2026 by Alan Hamilton
is licensed under CC BY-SA 4.0


