Chapter 7 — Sovereign‑Aware Observability Architecture
Summary
This chapter makes the case that observability in a sovereign, multi-cloud estate must move beyond traditional monitoring into a sovereignty-aware discipline that treats telemetry as regulated data, respects jurisdictional boundaries and provides evidence of continuous operational control. It extends the conventional three-pillar model (metrics, logs, traces) with events and topology as the fourth and fifth signals, and details the OpenTelemetry data model, OTLP protocol and context propagation mechanisms that standardise their collection. The chapter presents a federated observability architecture — zone-local backends retaining raw telemetry within sovereign boundaries, with only filtered aggregates exported to a central resilience view — and addresses the practical tension between DORA’s demands for rich, durable evidence and GDPR’s data minimisation requirements through patterns such as log scrubbing, field-level masking and tiered retention. It also covers the observability of AI components themselves, treating model invocations, agent decisions and confidence scores as first-class telemetry that feeds both operational diagnosis and the sovereign AI record required by the EU AI Act.
7.1 Why observability must become sovereignty‑aware
Observability started life as a mostly technical concern. The goal was to understand how applications behaved in production by collecting metrics, logs and traces, then using them to diagnose performance issues and bugs. As systems moved to the cloud and became more distributed, observability expanded into a discipline concerned with the full MELT stack—metrics, events, logs and traces—and with providing engineers the context they need to ask and answer arbitrary questions about system behaviour [1].
In a sovereign, zero‑copy, multi‑cloud world, observability gains an additional dimension. It must become sovereignty‑aware. It is no longer enough to know that a service is slow or that error rates have spiked. Operations teams must also know:
- Where the telemetry describing that behaviour is stored and processed.
- Who is able to see which slices of it, from where.
- Whether observability pipelines themselves might breach data residency or confidentiality commitments.
- How observability data can be used as evidence of control and compliance.
The observability plane described in Chapter 4 is, in effect, the sensory system of sovereign operations. If it is blind to certain zones, or if it inadvertently exports sensitive information across boundaries, the rest of the architecture cannot compensate. Conversely, when observability is designed with sovereignty in mind, it becomes one of the strongest sources of assurance that operations are under control.
Regulatory obligations make this more than an architectural preference. The Digital Operational Resilience Act (DORA) [2] requires financial entities to maintain comprehensive logs and audit records of their information and communication technology operations, with retention periods of up to five years for certain categories of evidence. The General Data Protection Regulation (GDPR) [3] imposes simultaneous constraints: personal data in those logs must not be kept longer than necessary, and its processing must be proportionate to the purpose. Log management guidance from NIST SP 800‑92 [4] establishes a foundation for what a defensible log management programme looks like, yet it pre‑dates cloud‑native observability by over a decade. Applying these requirements simultaneously—and across multiple jurisdictions with different national implementations—demands that observability be treated as a first‑class architectural concern from the outset, not a bolt‑on.
Executive Perspective
Observability is the mechanism by which an organisation proves — to itself, to its board, and to its regulators — that it is in control of what it operates. Without sovereignty-aware observability, an enterprise running workloads across multiple clouds and jurisdictions cannot demonstrate that sensitive data stayed where it was supposed to, that incidents were detected within required timeframes, or that the operational evidence demanded by DORA, GDPR and equivalent frameworks actually exists. The cost of getting this wrong is not abstract: regulatory penalties, protracted audit findings, and the inability to diagnose cross-border incidents under time pressure all translate directly into financial and reputational exposure. Investing in a federated observability architecture — one that keeps raw telemetry within sovereign boundaries whilst still providing a consolidated operational view — is therefore not a technical preference but a precondition for operating a regulated multi-cloud estate at scale.
7.2 From monitoring to contextual observability
7.2.1 The known‑unknown problem
Traditional monitoring tools focused on a predefined set of signals: CPU usage, memory consumption, request rates, error counts. They often required manual configuration and produced dashboards tied to individual hosts or services. In complex, dynamic environments, that approach breaks down because it is fundamentally oriented towards known unknowns—questions you already know to ask and have already instrumented answers for. It cannot keep pace with ephemeral infrastructure, auto‑scaling services and ever‑changing dependency graphs [5].
The intellectual shift that separates observability from monitoring is precisely this: observability, as the term is now used in distributed systems engineering, is the capacity to ask arbitrary questions of system state without having to deploy new instrumentation in advance. Charity Majors, Liz Fong‑Jones and others in the observability community have been explicit on this distinction [5]: monitoring tells you when something is wrong according to thresholds you have defined ahead of time; observability tells you why it is wrong, even when the failure mode is entirely novel. The former deals in known unknowns; the latter is designed to surface unknown unknowns—failure modes you did not anticipate when you wrote your dashboards. This distinction is not merely semantic. In a sovereign multi‑cloud environment, where the system topology changes continuously and regulatory scrutiny can attach to unanticipated failure paths, the capacity to reason about novel questions without re‑instrumentation is operationally essential [1].
7.2.2 The three pillars and their limitations
The telemetry landscape has historically been organised around three signals: metrics, logs and traces. Each has a distinct character and distinct limitations when considered in isolation.
Metrics are numerical measurements sampled over time—request latency at the 99th percentile, pod CPU utilisation, HTTP error rate. They are cheap to store, easy to alert on and well suited to time‑series dashboards. Their weakness is dimensionality: a metric aggregates across many events, discarding the contextual detail that would allow an engineer to understand which requests, which users, or which code paths produced an anomalous value [6]. The Prometheus data model [7], which has become a de facto standard for cloud‑native metrics collection, makes this trade‑off explicit: it stores labelled time series efficiently but cannot reconstruct individual request contexts.
Logs are discrete records of events: a service writes a structured or semi‑structured message each time something noteworthy occurs. They preserve context that metrics discard—the specific request path, error message, user identifier or payload fragment associated with a single event. Their weakness is volume and correlation: a distributed system producing millions of log lines per minute generates a haystack that is expensive to store and difficult to search without knowing in advance which needles to look for [4]. Correlation across service boundaries—finding the logs from service B that relate to a specific failing request handled by service A—is often painful and error‑prone without explicit trace identifiers embedded in each log record [6].
Traces represent the end‑to‑end journey of a request as it propagates across service boundaries. A trace is composed of spans, each representing a unit of work within one service, with parent–child relationships forming a directed acyclic graph. Traces reveal causality—they show that service A called service B which called a database, and that the database call accounted for 87 per cent of the end‑to‑end latency. Their limitation is instrumentation coverage: a trace is only as complete as the set of services that have been instrumented to propagate trace context, and a single un‑instrumented service breaks the chain [8].
7.2.3 Events and topology as the fourth and fifth signals
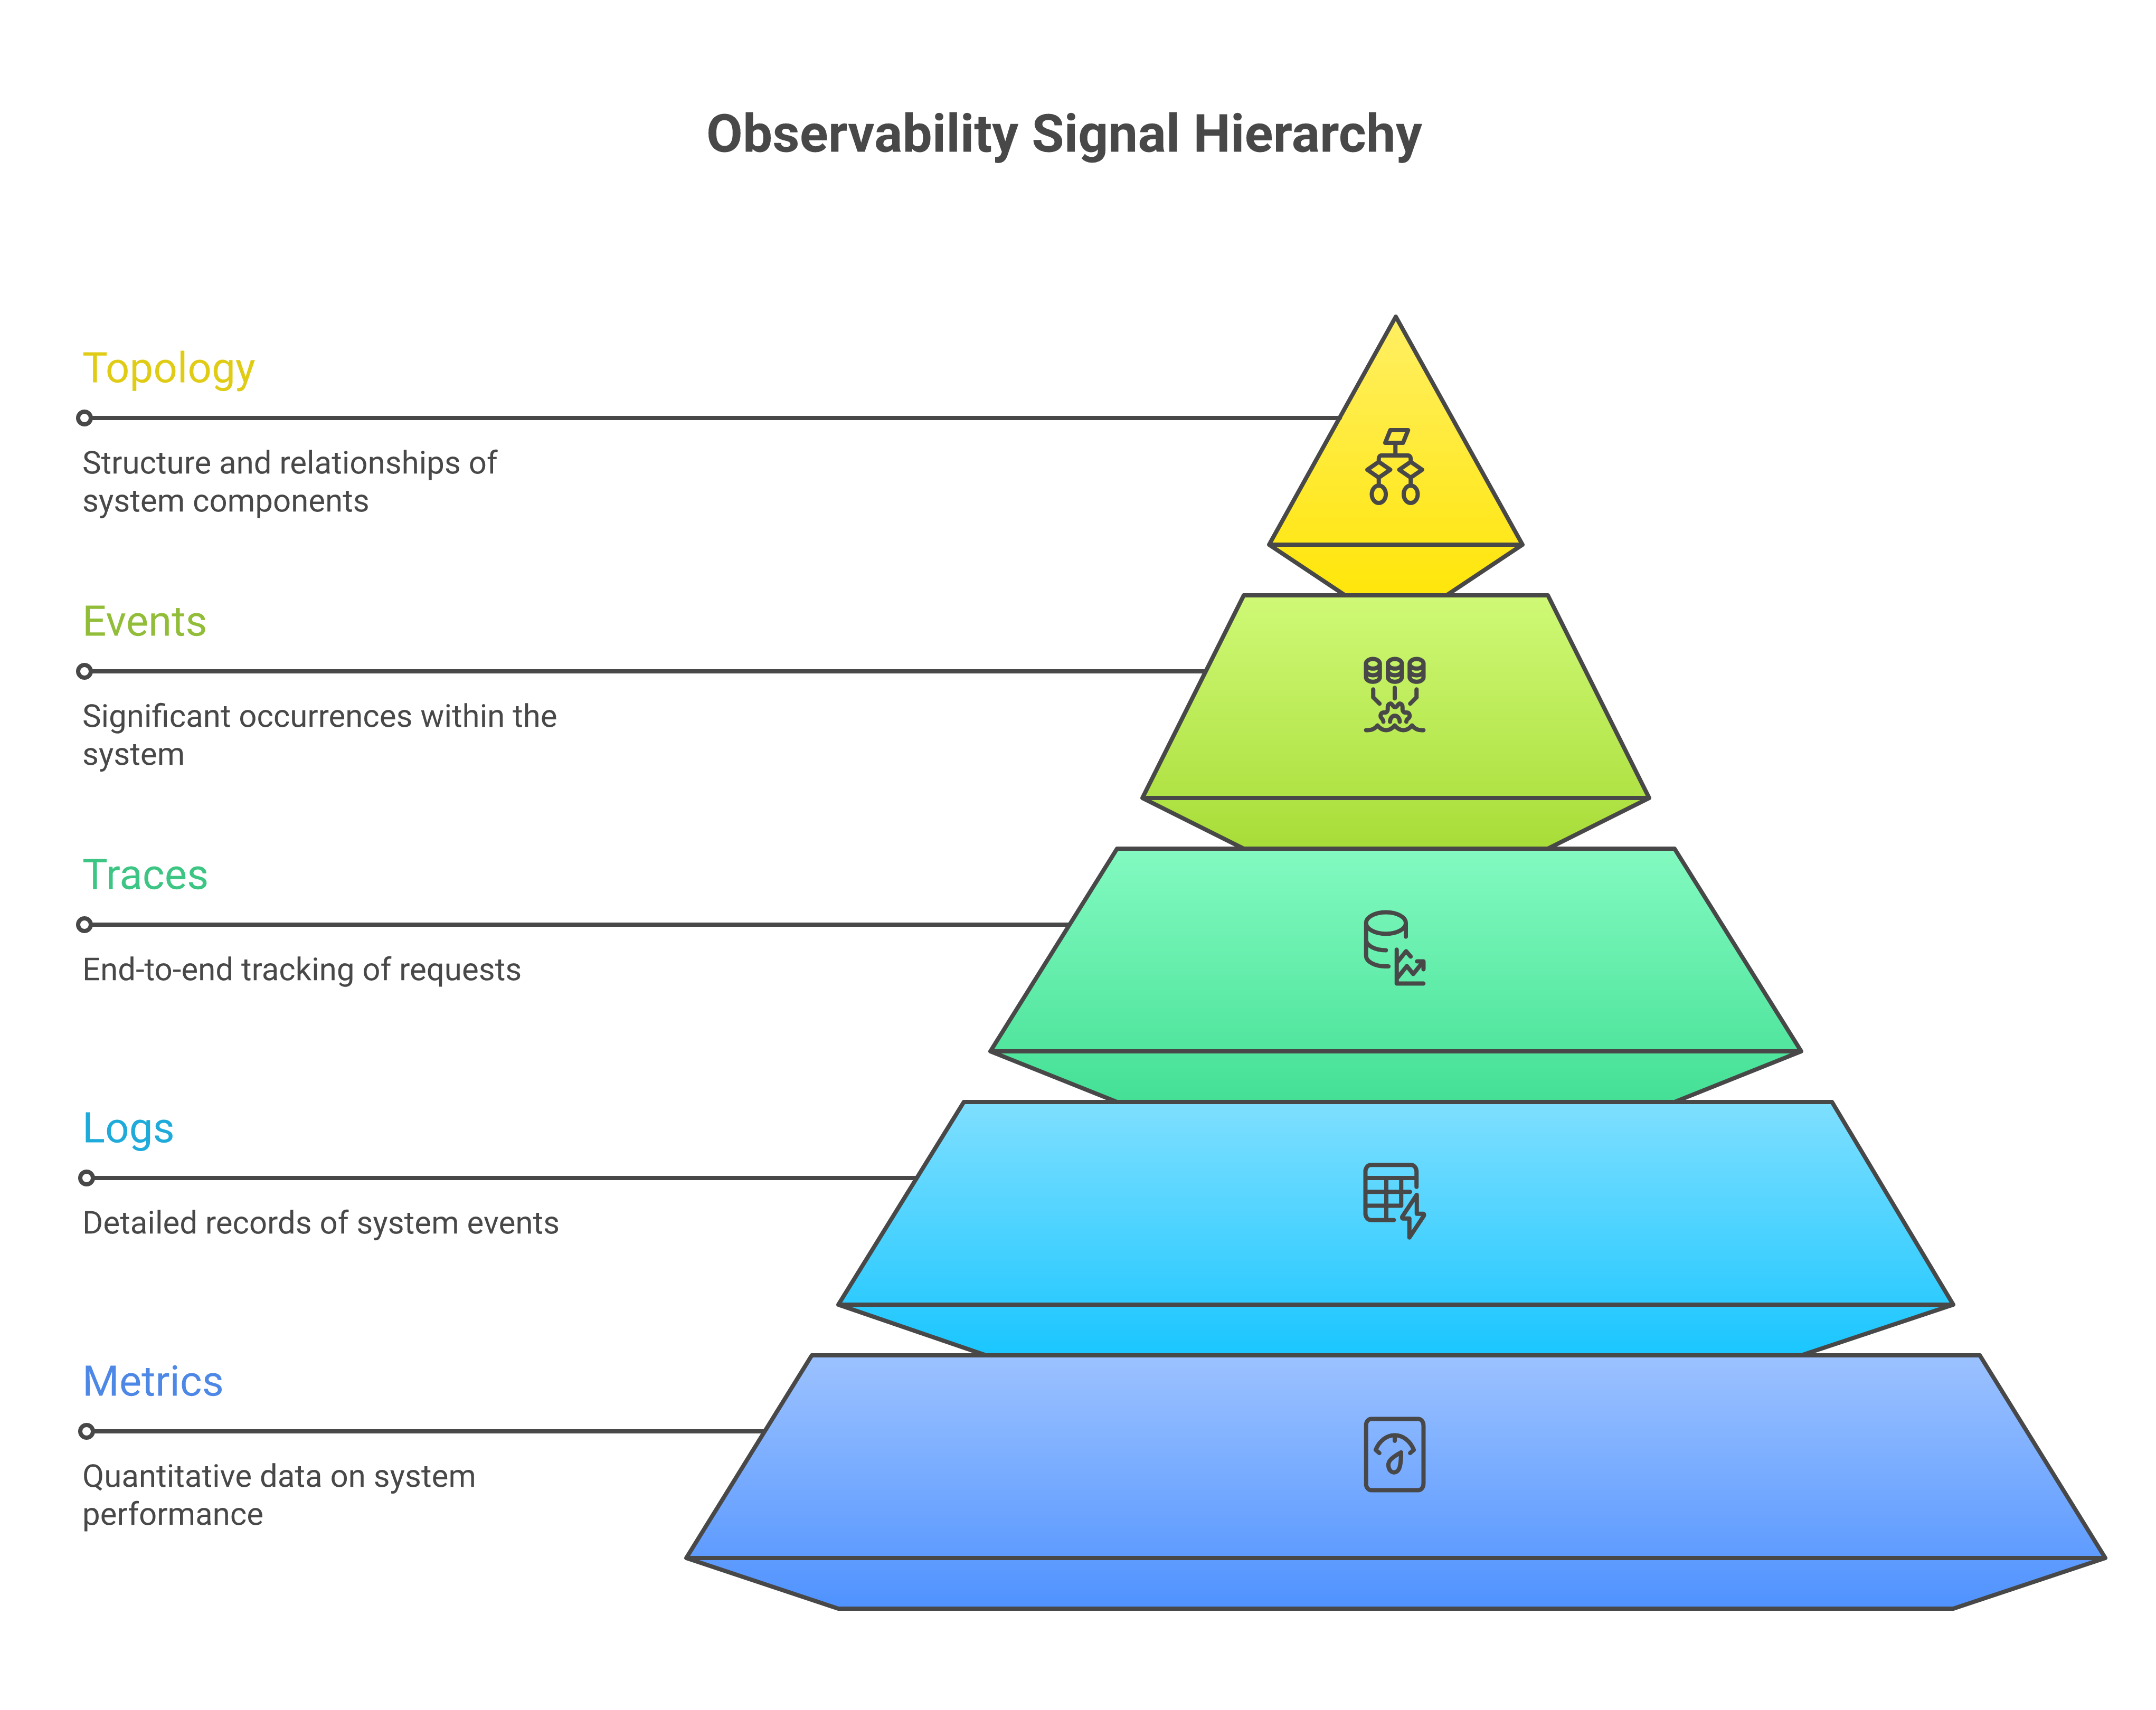
This architecture extends the conventional three‑pillar model with two further signal types that are essential for sovereign operations.
Events are discrete, high‑cardinality records of significant state transitions that differ from logs in their semantic intent. Where a log record might capture an informational message or a stack trace, an event captures a domain‑meaningful occurrence: a configuration change was committed, a deployment completed, a circuit breaker opened, a compliance policy was evaluated. The CNCF TAG Observability Whitepaper [9] identifies events as a distinct telemetry category whose correlation with metrics and traces is often the key to root cause analysis—understanding not just that latency increased at 14:32, but that a deployment completed at 14:31 and a configuration change was pushed at 14:30. In a sovereign context, change events are also primary audit evidence: they establish what changed, when and under whose authority.
Topology is the fifth signal, and it is qualitatively different from the others. Where metrics, logs, traces and events describe what happened, topology describes what exists and how it relates. It is the live dependency map of services, hosts, containers, databases and network paths, continuously maintained by discovery mechanisms. Topology is essential for two reasons. First, it provides the context that makes the other signals interpretable: knowing that a particular Kubernetes pod is running service X, which is a dependency of business capability Y, which serves customers in sovereign zone Z, is what transforms a raw metric anomaly into an actionable, prioritised incident. Second, topology is itself a governance artefact: demonstrating that services in a given zone have no unexpected communication paths to services in another zone requires a maintained, queryable topology map.
Modern observability tools such as IBM Instana operate on a different premise from traditional monitoring precisely because they make topology a first‑class concern. They discover applications, services and infrastructure automatically, map dependencies between them, and collect high‑fidelity telemetry with minimal manual configuration [10]. Rather than asking engineers to stitch together data from multiple point tools, they offer a unified view in which metrics, traces and logs are tied to a shared understanding of the system’s topology. This contextual approach is essential for sovereign operations. When an incident occurs, it is not enough to know that “CPU is high on node X.” You need to know which services are running on that node, which business capabilities they support, which sovereign zone they belong to, and which upstream and downstream dependencies might be affected.
7.2.4 The OpenTelemetry data model and OTLP
The mechanism by which these signals are captured, transmitted and correlated has been substantially standardised by the OpenTelemetry project, now a graduated CNCF project [8]. OpenTelemetry defines a vendor‑neutral data model and collection framework covering metrics, logs and traces, with events handled as a specialised log record type.
The OpenTelemetry data model is built on three foundational concepts. A resource is a set of attributes describing the entity that produces telemetry—the service name, service version, cloud provider, region, Kubernetes cluster and pod, or any other environmental attribute. Resources provide the context that makes individual signals interpretable. A scope (also called an instrumentation scope) identifies the library or component that produced a given signal, allowing consumers to filter or route data by its origin. A signal is the actual telemetry data—a metric data point, a log record, or a trace span—accompanied by its resource and scope context [8].
Signals are transmitted using the OpenTelemetry Protocol (OTLP), a gRPC‑ and HTTP‑based protocol designed for efficient, reliable transmission of telemetry from instrumented applications to collection endpoints. OTLP’s design deliberately avoids vendor lock‑in: any OTLP‑compliant collector can receive data from any OTLP‑compliant SDK, enabling organisations to change their observability backend without re‑instrumenting their applications [8].
Correlation across service boundaries is achieved through context propagation. When service A makes an outbound call to service B, it injects the current trace context—the trace identifier and the current span identifier—into the request headers using a standardised format (the W3C Trace Context specification [11]). Service B extracts this context, creates a child span, and associates it with the same trace. Log records emitted during span execution can be linked to that span by including the trace and span identifiers as log record attributes. The result is that a single trace identifier threads together spans from many services and log records from each, providing a coherent, navigable record of a single request’s journey [8]. In a sovereign architecture, this correlation capability has compliance significance: it enables demonstrating that a specific user‑facing transaction remained within a particular sovereign zone by examining the service topology visited by its trace.
7.3 Telemetry as regulated data
7.3.1 The regulatory basis for data minimisation in observability
For years, telemetry was treated as an operational by‑product—useful for engineers, but largely invisible to risk and compliance functions. That stance is no longer tenable. Logs, metrics and traces often contain or imply information about individual users, sensitive transactions, or system internals that could be exploited if exposed.
The legal basis for treating observability data with care is clear. GDPR Article 5(1)(c) establishes the principle of data minimisation: personal data shall be “adequate, relevant and limited to what is necessary in relation to the purposes for which they are processed” [3]. Applied to telemetry, this means that a log record should not contain a user’s full name, email address or session payload unless there is a specific, documented purpose that requires it and a legal basis for processing it. A trace that records the arguments to every function call, or a metric label that encodes a user identifier, may constitute processing of personal data for which the organisation has no documented justification. Article 32 of the GDPR further requires that appropriate technical and organisational measures be applied to ensure a level of security appropriate to the risk [3], which extends to the security of observability stores and pipelines.
NIST SP 800‑92 [4], though written before cloud‑native observability became prevalent, provides foundational guidance on log management planning, including the need to identify what data logs will contain, how sensitive that data is, and what protections are appropriate. Its framework remains a useful baseline for constructing log management policies in regulated environments, even where the specific technologies have evolved significantly.
DORA Article 12 and its associated regulatory technical standards require financial entities to maintain logs of ICT‑related incidents and the actions taken in response, with retention periods varying by incident severity [2]. This creates a genuine tension: DORA wants rich, durable evidence; GDPR wants minimal personal data retained for no longer than necessary. Resolving this tension requires deliberate architectural choices.
7.3.2 Practical patterns for privacy‑respecting telemetry
Several patterns have emerged for collecting observability data that is rich enough to support diagnosis and compliance evidence whilst remaining within data minimisation principles.
Log scrubbing is the process of removing or replacing sensitive field values before log records enter the storage tier. An OpenTelemetry Collector pipeline can apply a transform processor that matches patterns corresponding to email addresses, credit card numbers, national insurance numbers or session tokens and replaces them with redacted markers prior to forwarding to the storage backend. This approach is effective but requires continuous maintenance as data formats evolve: a new field introduced by a development team may bypass existing scrubbing rules until discovered. Automated discovery of personal data patterns in telemetry streams, analogous to data loss prevention scanning in network traffic, is an emerging practice that addresses this gap [9].
Field‑level masking is a more surgical technique applied at the instrumentation layer. Rather than scrubbing data after collection, instrumentation libraries are configured to mask specific fields at source—for example, replacing a user identifier with a hash or a pseudonym before it is ever included in a log record or trace attribute. The OpenTelemetry SDK provides attribute filtering hooks for this purpose [8]. Masking at source is preferable to scrubbing because it reduces the risk that personal data will be stored temporarily in an intermediate buffer before scrubbing is applied.
Pseudonymisation of user identifiers in traces deserves particular attention. Distributed tracing is most useful when trace data can be linked to specific users or sessions—for example, to investigate a complaint from a particular customer. If user identifiers are pseudonymised, this correlation remains possible for authorised operators who hold the mapping, whilst the trace data in the observability store does not constitute directly identifying information under GDPR recital 26. The pseudonymisation mapping must itself be held securely and subject to access controls, but this arrangement allows rich tracing whilst substantially reducing the regulatory risk associated with telemetry stores.
7.3.3 Jurisdiction‑constrained telemetry routing
In a sovereign multi‑cloud environment, the question of where telemetry goes is as important as what it contains. Centralising all logs and metrics in a single global backend may be convenient, but it can conflict with sovereignty commitments if that backend sits outside certain jurisdictions or under foreign operational control [12].
The OpenTelemetry Collector is the natural point at which routing decisions are made. Collectors can be configured with pipeline definitions that specify, per data source, which exporters receive the data. In a sovereign architecture, collectors deployed within a given zone are configured to export to backends that are also within that zone. A secondary pipeline may export a reduced, aggregated or anonymised view to a federated global backend, subject to explicit policy authorisation. The critical property is that raw telemetry never crosses zone boundaries uncontrolled: every cross‑boundary flow is the result of an explicit architectural decision, documented in policy, and auditable.
Kleppmann [6] observes that in distributed data systems, the question of where data is processed is as consequential as the question of what processing is performed. This insight applies directly to telemetry pipelines: routing decisions made in collection infrastructure are, in effect, data governance decisions, and they should be treated with the same rigour as routing decisions in primary data pipelines.
7.3.4 Sector-specific telemetry obligations
The data minimisation and routing patterns described above address the broad DORA–GDPR tension, but sector-specific regulatory frameworks impose additional requirements on what the observability pipeline must capture, scrub, or retain (see Chapter 3 for a comprehensive treatment). In healthcare environments, HIPAA’s Security Rule requires that electronic protected health information (ePHI) be safeguarded wherever it appears, including in observability telemetry; log scrubbing pipelines must therefore identify and redact patient identifiers, diagnostic codes and clinician notes that may leak into application traces or structured log fields before those records reach the storage tier [18]. The EU Medical Device Regulation (EU MDR) introduces a complementary obligation for software classified as a medical device (SaMD): manufacturers must conduct post-market surveillance that includes operational telemetry — performance metrics, anomaly rates and failure events — feeding continuous safety monitoring over the device’s lifetime [19]. This means the observability plane is not merely an operational convenience for SaMD workloads; it is a regulatory deliverable whose scope and retention must satisfy the notified body’s expectations.
Sustainability reporting adds a further dimension. The Corporate Sustainability Reporting Directive (CSRD) requires in-scope organisations to disclose energy consumption and greenhouse gas emissions for their digital infrastructure [20]. Capturing data centre power draw, cooling efficiency metrics and workload energy attribution as part of the observability plane — rather than relying on separate facilities-management systems — ensures that sustainability evidence is produced with the same rigour, timeliness and auditability as operational telemetry. Organisations that treat energy metrics as first-class observability signals will find CSRD reporting substantially less burdensome than those that must assemble the data retrospectively from disparate sources.
7.3.5 Retention limits and the DORA–GDPR tension
DORA requires financial entities to retain logs and ICT incident records for periods that may extend to five years for major incidents [2]. GDPR’s data minimisation and storage limitation principles [3] require that personal data not be retained beyond the period necessary for its collection purpose. These two requirements pull in opposite directions when the evidence required to satisfy DORA contains, even incidentally, personal data.
The architectural resolution lies in separating the retention of operational evidence from the retention of personal data within that evidence. Logs retained for DORA compliance purposes can have personal data fields redacted or pseudonymised at or before the point of storage, leaving the operational content—timestamps, error codes, service identifiers, transaction references, action outcomes—intact for audit purposes whilst removing the personal data that GDPR would require to be deleted. This approach requires that personal data fields be identified and classified in advance, which is itself a valuable exercise in data governance.
The observability architecture must therefore include explicit retention and deletion policies, applied per data type and per sovereign zone, and enforced by the storage tier rather than left to manual process. The combination of automated scrubbing, pseudonymisation and retention enforcement means that the organisation can hold the evidence DORA requires without accumulating personal data liabilities that GDPR prohibits.
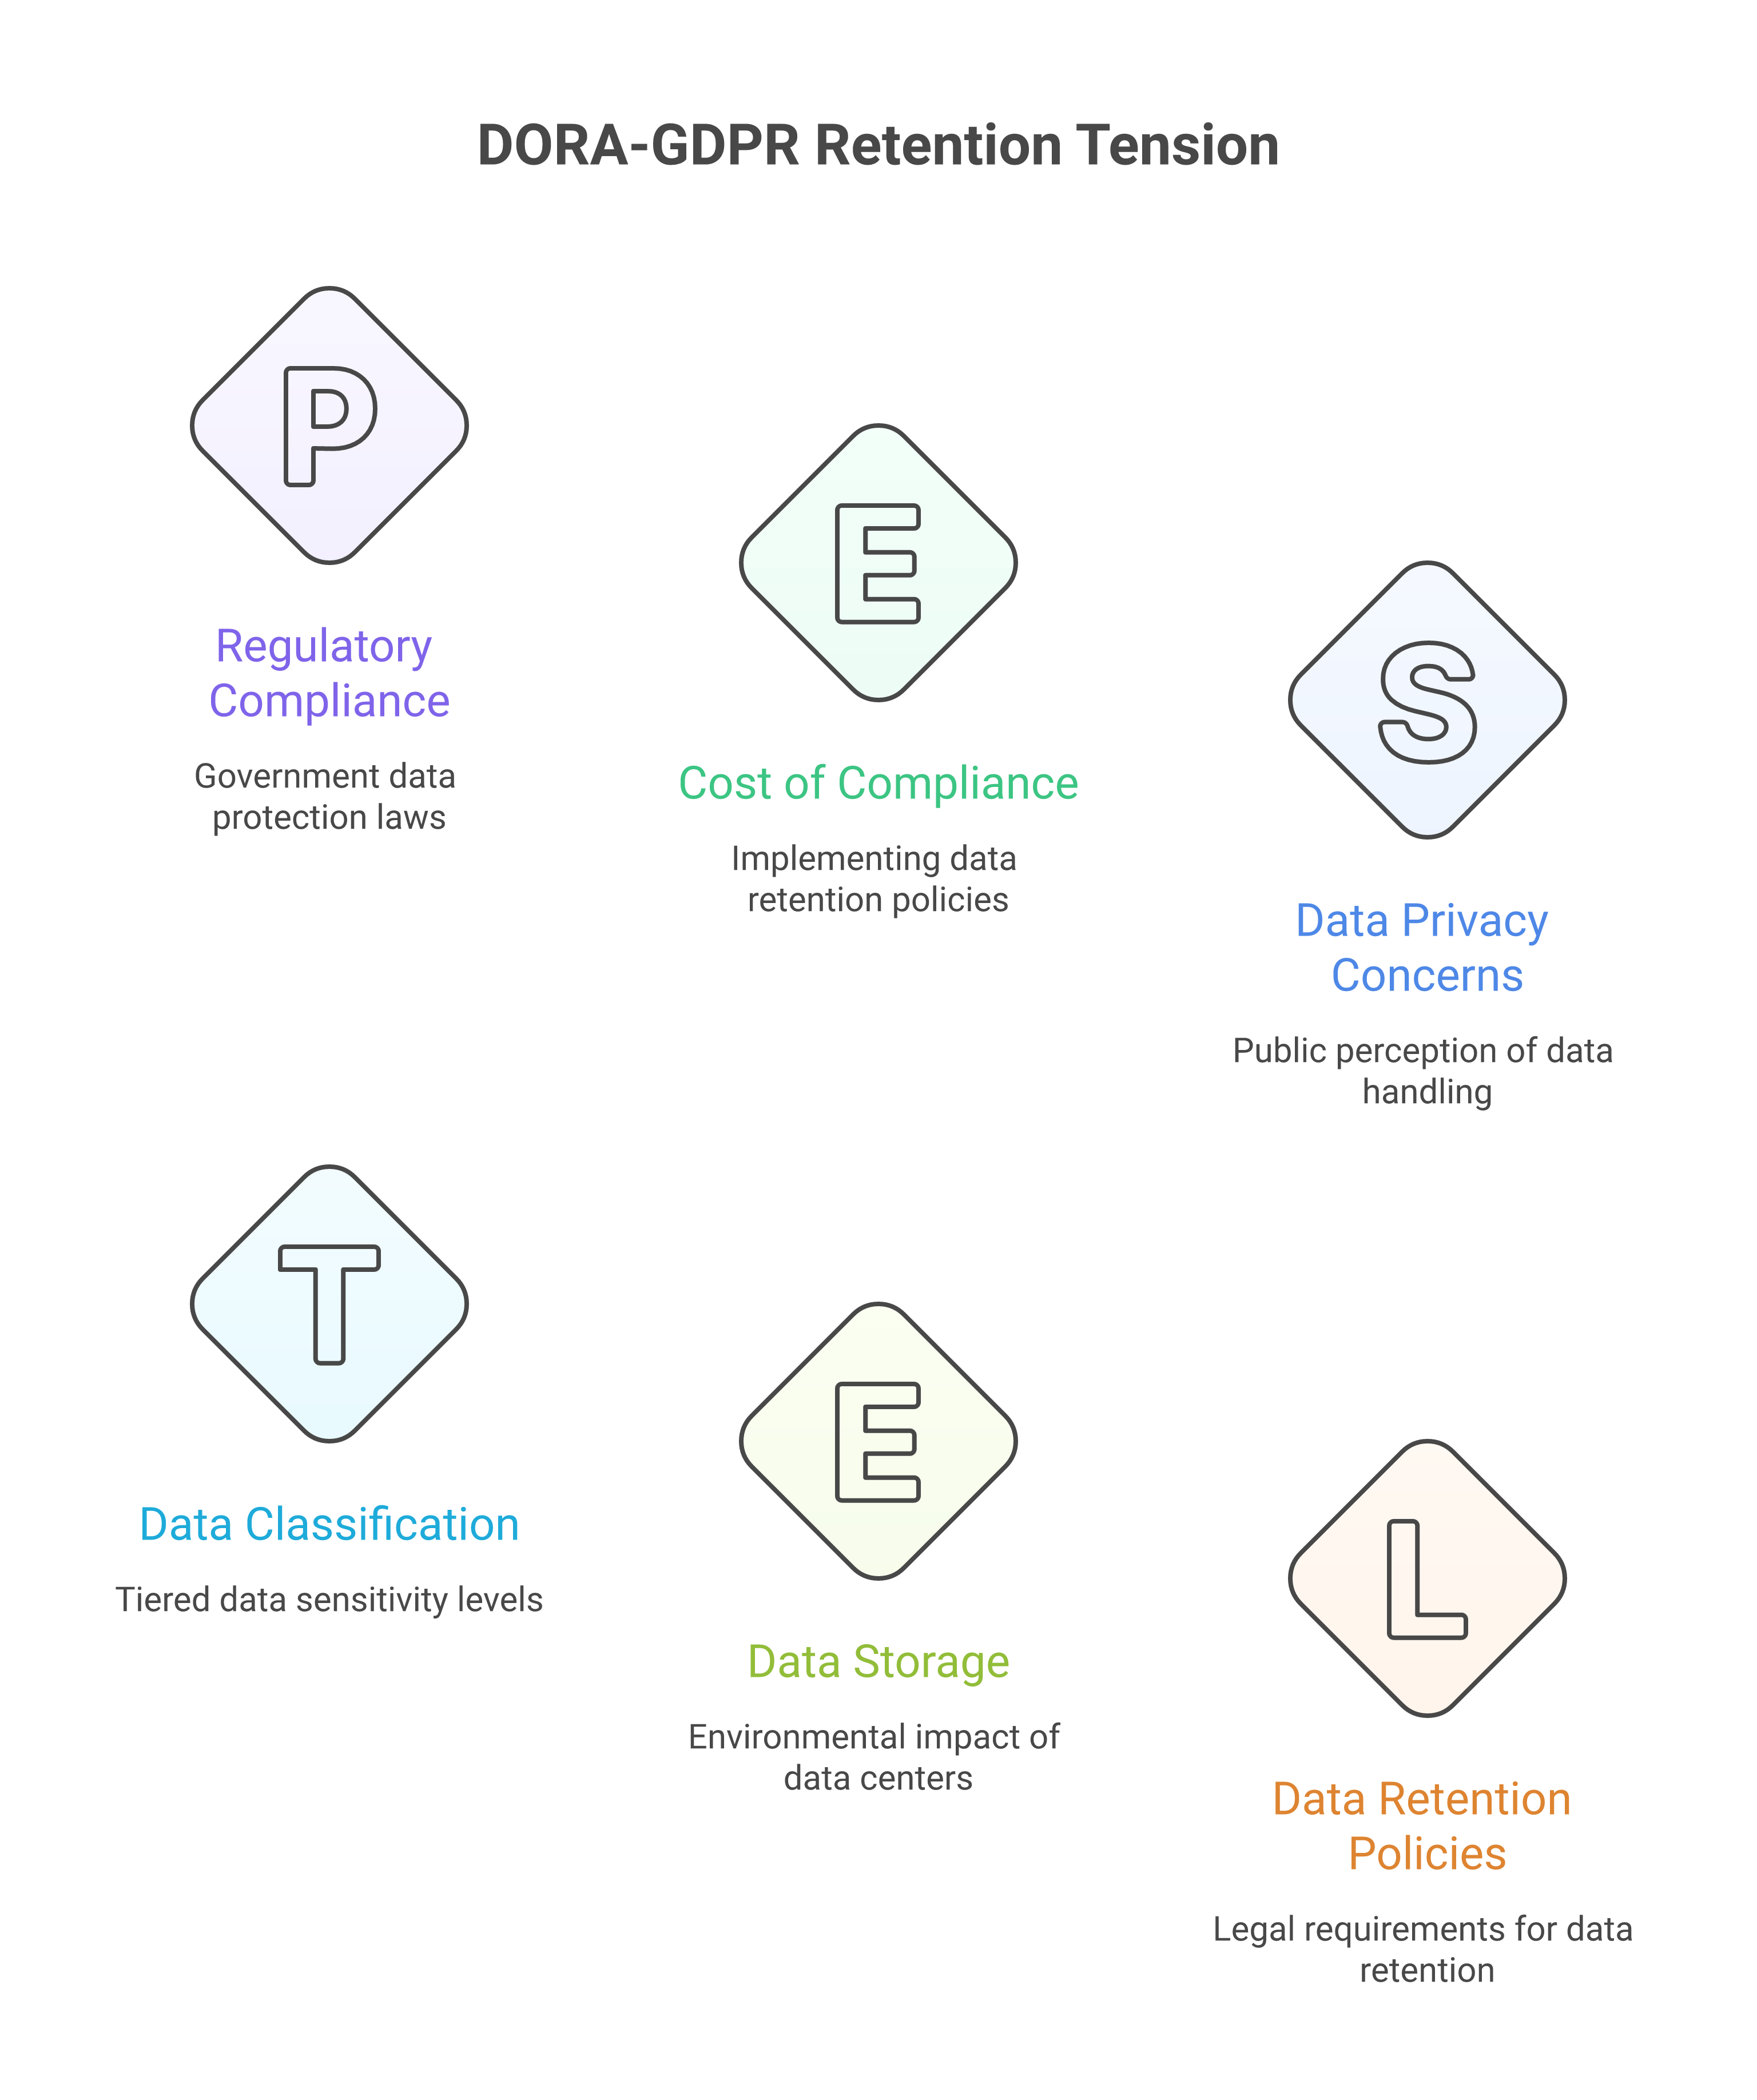
The resolution of this tension also requires an explicit data classification layer within the observability architecture itself. Not all telemetry is equally sensitive. Infrastructure metrics—CPU utilisation, memory pressure, disk I/O—are unlikely to contain personal data and may be retained for longer periods under more permissive access controls. Application traces that include request parameters or user session identifiers are more sensitive and warrant shorter retention windows, stricter access controls and the pseudonymisation techniques described above. Log records that include payload fragments from financial transactions may be subject to the most stringent controls of all, requiring storage in a dedicated, access‑controlled store separate from general operational logs. Defining and maintaining this classification—and automating its enforcement through storage tier configuration, not manual discipline—is a prerequisite for operating in a multi‑jurisdiction environment where the applicable rules differ by data type, zone and regulatory regime.
7.4 Architecture of a sovereign‑aware observability plane
7.4.1 The collector tier: zone‑local filtering and routing
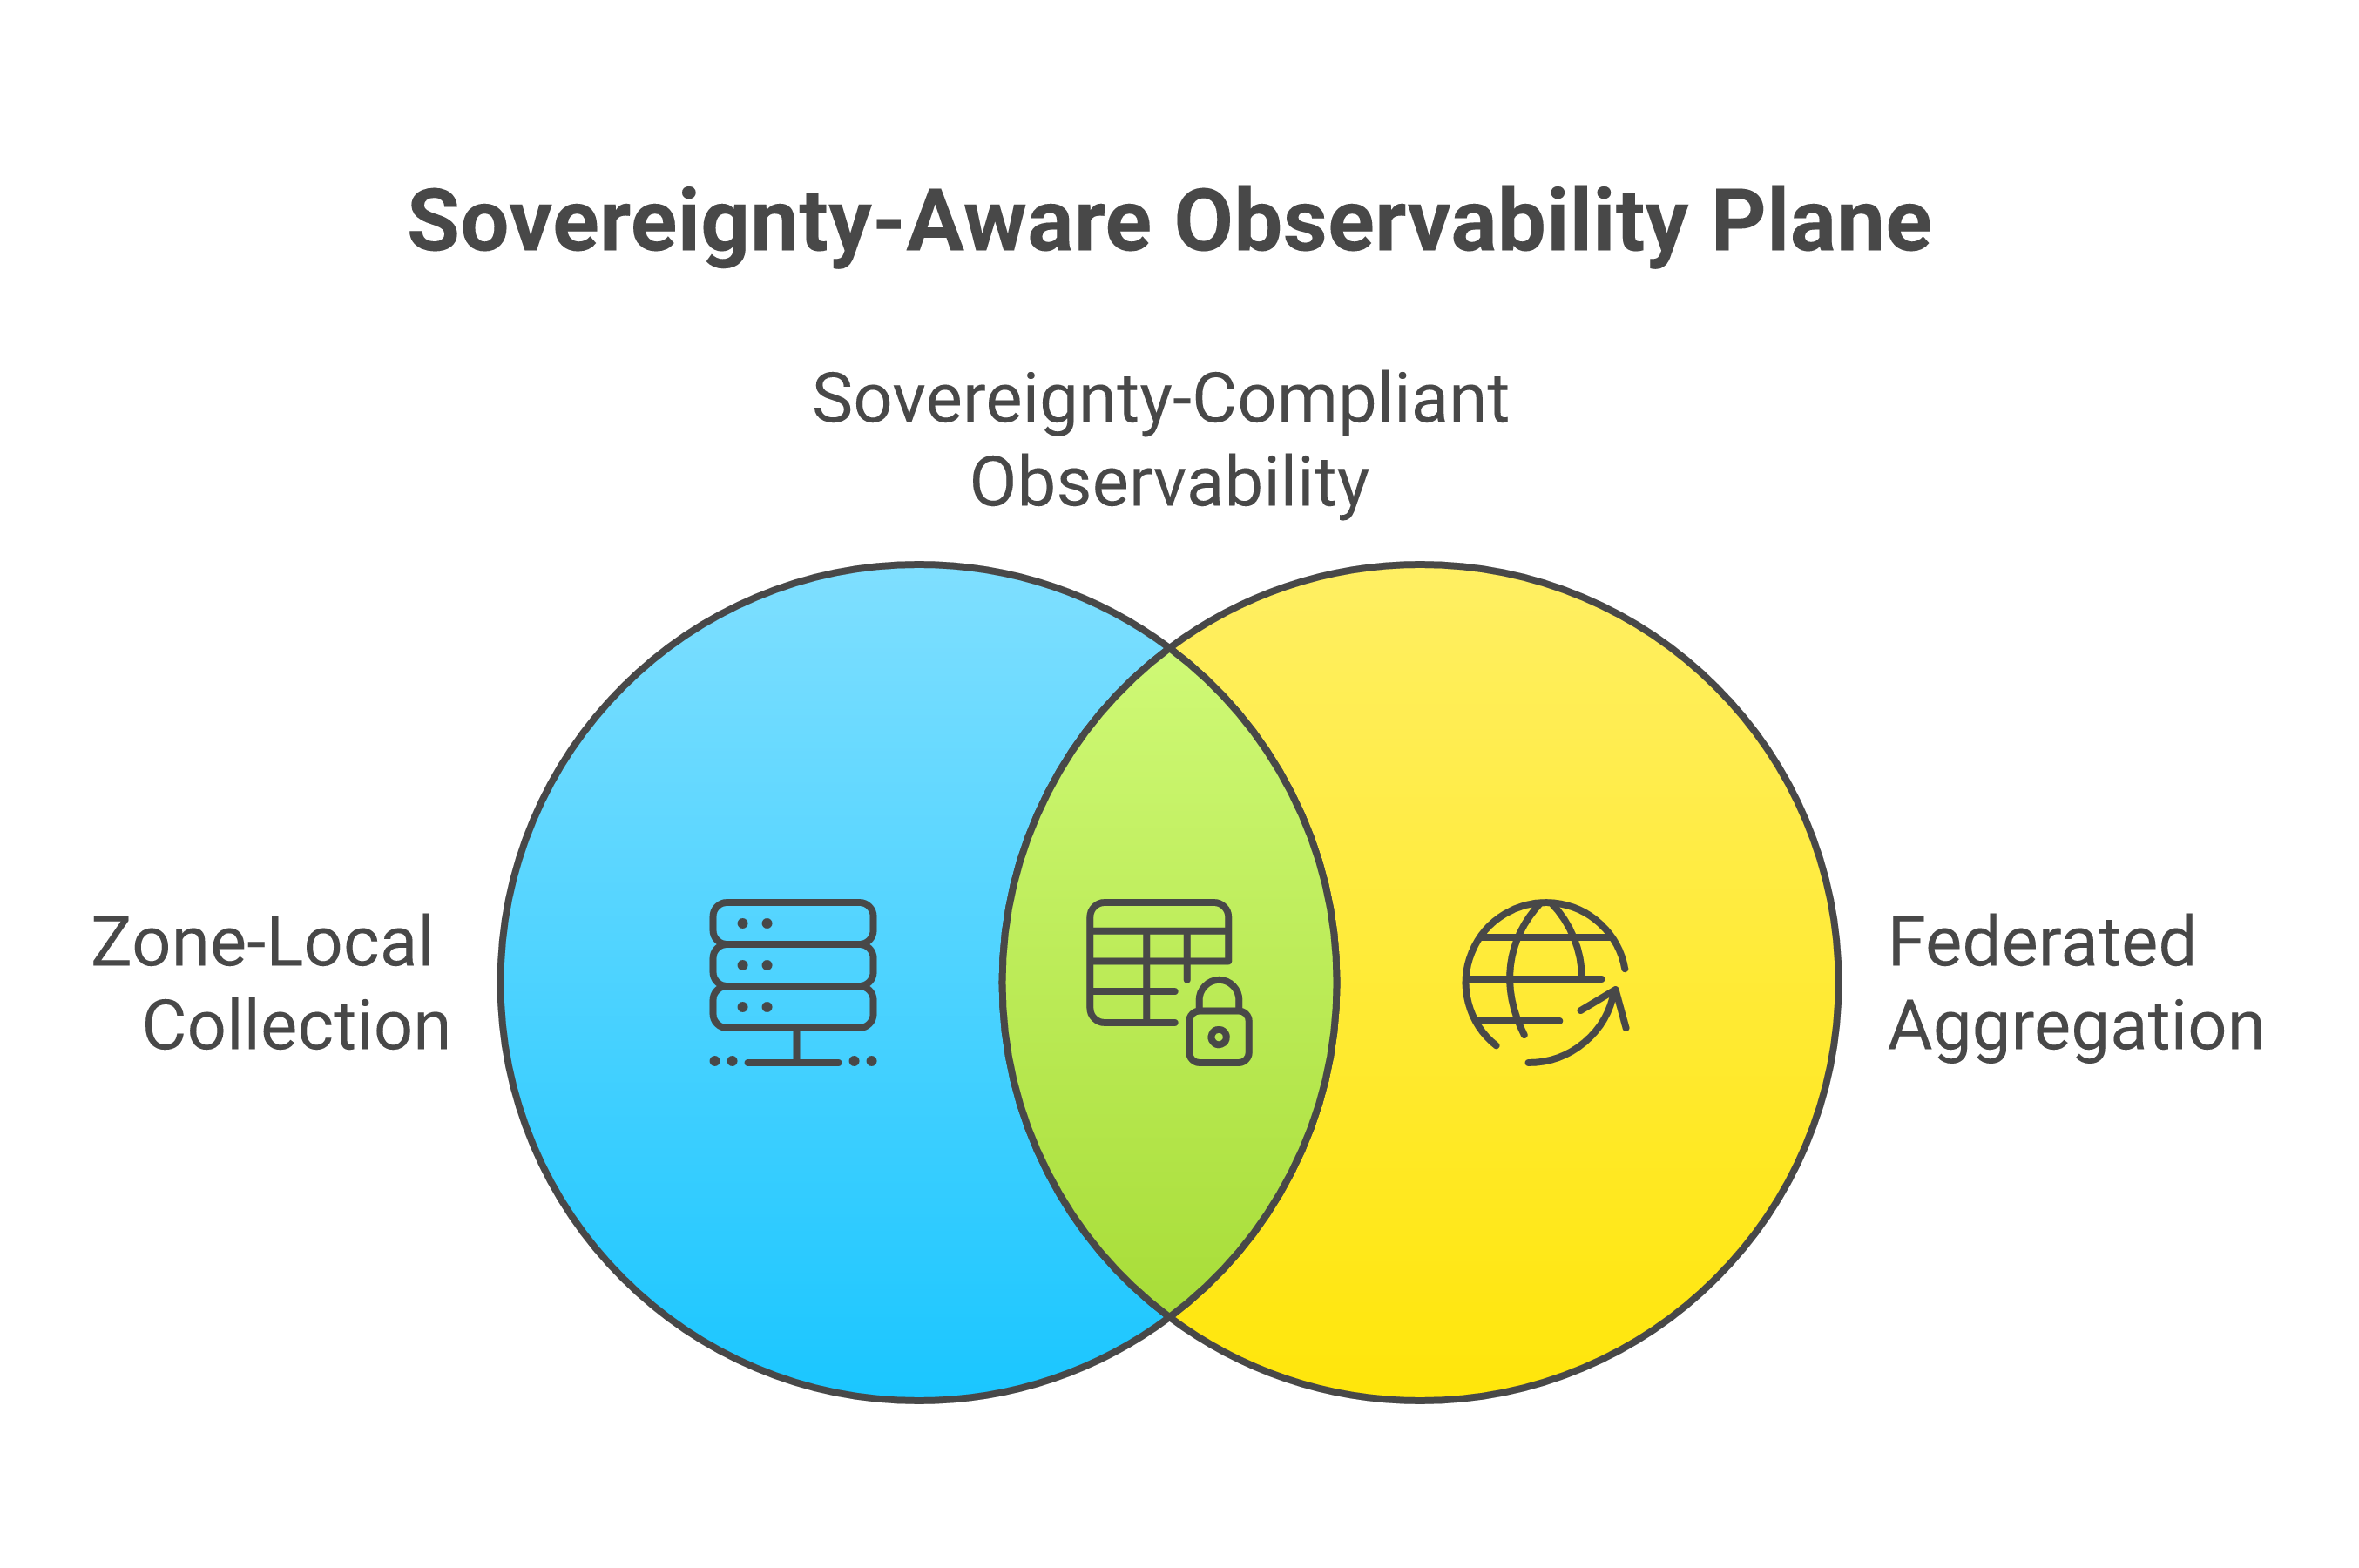
A sovereign‑aware observability architecture is structured in three tiers, each with a distinct responsibility. The first and most critical is the collector tier, deployed at the edge of each sovereign zone.
Collectors in this architecture are instances of the OpenTelemetry Collector [8], deployed as daemon sets on Kubernetes clusters or as standalone processes on virtual machine hosts within each zone. Their role is threefold. First, they receive raw telemetry from instrumented applications and infrastructure agents via OTLP, converting from any vendor‑specific formats where necessary using the receiver plugins that the Collector ecosystem provides. Second, they filter and transform the telemetry: applying scrubbing rules to remove personal data, enriching records with zone‑level resource attributes (sovereign zone identifier, data classification, regulatory jurisdiction), and dropping any signals that policy has identified as too sensitive to leave the zone. Third, they route the processed telemetry: to zone‑local backends for storage and query, and to federated pipelines for the reduced, aggregated view that global dashboards and AI models require.
The zone‑local collector tier also provides buffering and resilience. If a zone’s upstream connection to a central backend degrades or is deliberately severed (as may happen in an isolated sovereign zone), local collectors continue to accept and buffer telemetry, writing to local backends until connectivity is restored. This ensures that observability is not dependent on cross‑zone connectivity—a requirement that aligns with both operational resilience and sovereignty objectives.
Instana agents deployed within each zone act as a complementary layer to the OpenTelemetry collector tier. The Instana agent provides automatic discovery of services, processes and infrastructure without requiring manual instrumentation of each component [10]. It discovers JVM processes, containerised workloads, databases and network paths, and reports them to the zone‑local Instana backend. The combination of OpenTelemetry‑based instrumentation for application‑level traces and metrics, and Instana agent‑based discovery for infrastructure and topology, gives the collector tier both depth (high‑fidelity application telemetry) and breadth (automatic infrastructure coverage).
7.4.2 The aggregation tier: zone‑local storage and query
The second tier is the aggregation tier, providing within‑zone storage and query capability for the telemetry collected by the collector tier. This is where metrics are persisted and queried, logs are indexed and searched, traces are stored and navigated, and topology graphs are maintained.
For metrics, the combination of Prometheus [7] and Thanos provides a well‑established open‑source solution. Prometheus scrapes metrics from services and the OpenTelemetry Collector’s Prometheus exporter endpoint, storing them in a local time‑series database. Thanos extends Prometheus with long‑term storage (backed by object storage local to the zone), high availability through multiple Prometheus replicas, and a query federation layer that can serve queries across multiple Prometheus instances. This architecture ensures that metrics data remains within the zone whilst providing the retention depth that DORA evidence requirements demand.
IBM Instana’s backend architecture provides the aggregation tier for topology, traces and multi‑signal correlation [10]. The Instana backend receives data from Instana agents deployed throughout the zone, maintaining a continuously updated dynamic graph of the zone’s service and infrastructure topology. It correlates metrics, traces and events against this topology graph, enabling engineers and agents to navigate from a metric anomaly to the affected services, from the affected services to their traces, and from the traces to the specific log records associated with a failing request. This multi‑signal correlation, anchored in topology, is the practical realisation of the contextual observability described in section 7.2.
Multi‑tenant isolation within the Instana backend is an important capability for sovereign environments where a single observability platform may serve multiple organisational entities with different data access rights. Instana’s architecture supports logical isolation between tenants: data from different sovereign zones or business units can be held in separate logical units within the platform, with access controls enforced at query time. This enables a centralised operations team to have a global view whilst ensuring that analysts in one zone cannot access raw telemetry from another.
7.4.3 The federation tier: cross‑zone aggregates without raw data export
The third tier is the federation tier, which serves the legitimate need for global dashboards, cross‑zone resilience analysis and centralised AI model inputs, whilst ensuring that raw telemetry never leaves its zone of origin without authorisation.
Federation operates on the principle of query federation rather than data replication. Rather than copying raw telemetry to a central store, the federation tier sends queries to zone‑local aggregation backends and assembles the results centrally. Thanos implements this pattern for metrics: its Query component can route metric queries to multiple Thanos sidecar instances in different zones and merge the results, giving the appearance of a unified global metrics view without centralising the underlying data [7]. IBM Concert uses a similar pattern for resilience topology: it queries zone‑local Instana backends for service dependency information, assembles a global topology model, and uses it to reason about cross‑zone resilience risks—without requiring that raw telemetry from any zone be held in Concert’s own store [13].
Where cross‑boundary data flow is required—for example, to feed a global AI anomaly detection model—the federation tier enforces data minimisation at the boundary. Only aggregated metrics (not raw data points), anonymised topology (not identifiable service names where those would breach confidentiality), and derived indicators (not raw logs) cross zone boundaries. Each cross‑boundary flow is logged as an audit event, creating a record of what was shared, when, with which recipient, and under which policy authorisation.
7.4.4 Alert routing without raw telemetry export
Alert generation in this architecture follows the same zone‑local principle as telemetry storage. Alerting rules are evaluated by zone‑local components—Prometheus alerting rules for metrics, Instana’s anomaly detection for multi‑signal events—and alerts are generated within the zone before being routed to centralised incident management systems.
The alert payload sent to a centralised ITSM platform contains the alert metadata—severity, affected service, sovereign zone, timestamp, alert identifier—but not the raw telemetry that triggered it. If an engineer handling the incident in a central service desk needs to examine the underlying telemetry, they must access the zone‑local observability backend (subject to appropriate access controls) rather than finding the raw data embedded in the alert. This architectural separation ensures that the incident management workflow does not inadvertently create a channel for raw telemetry to flow to parties who would not otherwise have access to it.
7.4.5 The dual‑layer pattern: native depth with federated breadth
A legitimate concern with any federated observability architecture is that it risks producing a “lowest common denominator” view of each cloud platform. AWS CloudWatch, Azure Monitor and GCP Cloud Monitoring are not merely monitoring tools; they are deeply integrated into their respective control planes and expose proprietary signals that no external collector can replicate [21][22][23]. An architecture that asks engineers to abandon those tools in favour of a purely OpenTelemetry‑based pipeline would sacrifice real operational depth for the sake of architectural purity. The sovereign observability plane described in this chapter does not make that trade‑off. It is designed as a dual‑layer architecture: native cloud monitoring tools remain the first tier for deep platform diagnosis, whilst the federated observability plane — Instana, OpenTelemetry and Concert — provides the cross‑cloud correlation and sovereign governance layer that native tools cannot.
Preserving proprietary depth. Each hyperscaler’s monitoring stack captures signals that are structurally unavailable to external instrumentation. AWS CloudWatch Logs Insights provides full‑text query over Lambda execution logs with sub‑second latency; X‑Ray traces capture internal AWS service hops that OpenTelemetry spans cannot see; RDS Performance Insights surfaces wait‑event analysis from the database engine’s internal instrumentation; and CloudWatch Anomaly Detection applies per‑metric machine‑learning baselines trained on account‑specific historical patterns [21]. Azure Application Insights offers end‑to‑end transaction tracing that includes Azure Functions cold‑start diagnostics and dependency injection context; Log Analytics workspaces provide Kusto query language (KQL) over petabyte‑scale log stores; and Azure Diagnostics captures platform‑level events — quota exhaustion, throttling, internal failover — that never surface in application‑layer telemetry [22]. GCP Cloud Monitoring integrates tightly with managed services such as BigQuery, Spanner and Cloud Run, providing resource‑utilisation metrics and internal health signals that are not exposed through any external API [23]. None of these capabilities should be surrendered. Engineers troubleshooting a Lambda cold‑start regression or an RDS wait‑event spike should continue to use the native tools purpose‑built for those tasks. The claim that a federated observability plane replaces native tools is a straw man; the claim this architecture makes is that native tools alone are insufficient for a multi‑cloud, multi‑jurisdiction estate.
The forwarding bridge. The dual‑layer pattern works because it is not a choice between native tools and federated tools; it is a pipeline that begins with native signals and selectively forwards what the cross‑cloud layer needs. OpenTelemetry Collector receivers exist for CloudWatch metrics (via the AWS CloudWatch receiver), Azure Monitor (via the Azure Monitor exporter and Event Hubs integration), and GCP Cloud Monitoring (via the Google Cloud receiver) [8]. These receivers ingest high‑level health metrics, resource‑state changes and platform events from each cloud’s native monitoring APIs and convert them to OTLP, at which point they enter the zone‑local collector pipeline described in section 7.4.1. Not every native signal needs to cross this bridge — only the signals required for cross‑cloud correlation, topology updates and sovereign governance. The selection of which signals to forward is itself a policy decision, documented and auditable, governed by the same data minimisation principles that apply to all cross‑boundary telemetry flows.
Concert as a correlation layer, not a replacement. IBM Concert’s value in this architecture is precisely that it does not attempt to replicate the depth of each cloud’s native tooling. Concert ingests high‑level health indicators, topology changes and OpenTelemetry trace summaries from each sovereign zone [13]. It uses these to build a cross‑cloud application topology, identify resilience risks that span zone boundaries, and surface compliance posture across the estate. It does not need Lambda execution context or RDS wait‑event detail to perform this function; it needs enough context to answer the question: “Is the distributed application healthy, and are its sovereign commitments being met?” When Concert identifies a cross‑boundary anomaly, the engineer’s workflow is to drill down into the relevant zone’s native tools — CloudWatch, Application Insights or Cloud Monitoring — for root cause analysis. The federated layer tells you where to look; the native layer tells you what is wrong.
An honest treatment of mean time to resolution. The dual‑layer pattern does not uniformly reduce mean time to resolution (MTTR) across all incident categories. For incidents confined to a single cloud platform — a misconfigured security group, a database parameter change causing lock contention, a storage throttling event — native tools will remain the fastest path to diagnosis, and the federated layer adds no value to that particular investigation. Where MTTR improves materially is in cross‑boundary incidents: a latency degradation that originates in one cloud’s network path but manifests as timeouts in a service running on another cloud; a cascading failure triggered by a change in one zone that destabilises a dependency in a second zone; a data‑sovereignty violation in which a workload has been inadvertently scheduled outside its designated jurisdiction. These are precisely the incidents for which native tools are blind — CloudWatch cannot correlate with Azure Monitor, and neither can reason about sovereign zone boundaries. They are also, in practice, the most costly incidents: cross‑boundary failures tend to be longer‑lived, harder to diagnose, more likely to escalate to senior leadership, and more likely to attract regulatory scrutiny. The net effect of the dual‑layer pattern on organisational MTTR is therefore positive, weighted by incident cost: it does not accelerate every investigation, but it disproportionately accelerates the investigations that matter most.
7.5 Network‑aware observability
As Chapter 5 emphasised, in zero‑copy, multi‑cloud architectures the network is the integration fabric. Observability must therefore include a network‑aware perspective.
Instana’s full‑stack model does this by automatically discovering not only processes and services but also the network paths between them [10]. It can show, for example, how traffic flows from a web frontend in one cloud region to a backend in another, through load balancers, gateways and service meshes along the way. It can attribute latency to different segments of that path, revealing whether performance issues are local to a service or rooted in network behaviour.
This is especially important for sovereign operations because many sovereign zones are connected via carefully controlled links—private interconnects, VPNs, dedicated peering arrangements. When those links degrade, the impact can be wide‑ranging. Without network‑aware observability, teams may misdiagnose such issues as application problems or database slowness.
Secure connectivity patterns, such as routing Instana traffic over AWS PrivateLink instead of the public internet, illustrate how observability and network design intersect [12]. PrivateLink allows telemetry to flow from AWS VPCs to Instana backends without traversing public networks, reducing exposure and egress costs while maintaining visibility. Similar patterns exist for other cloud providers.
In a sovereign context, network‑aware observability must also differentiate between internal and cross‑boundary paths. Engineers and agents need to see, for a given transaction, which parts stayed within a sovereign zone and which crossed to other zones or providers. That information underpins both incident response and compliance evidence.
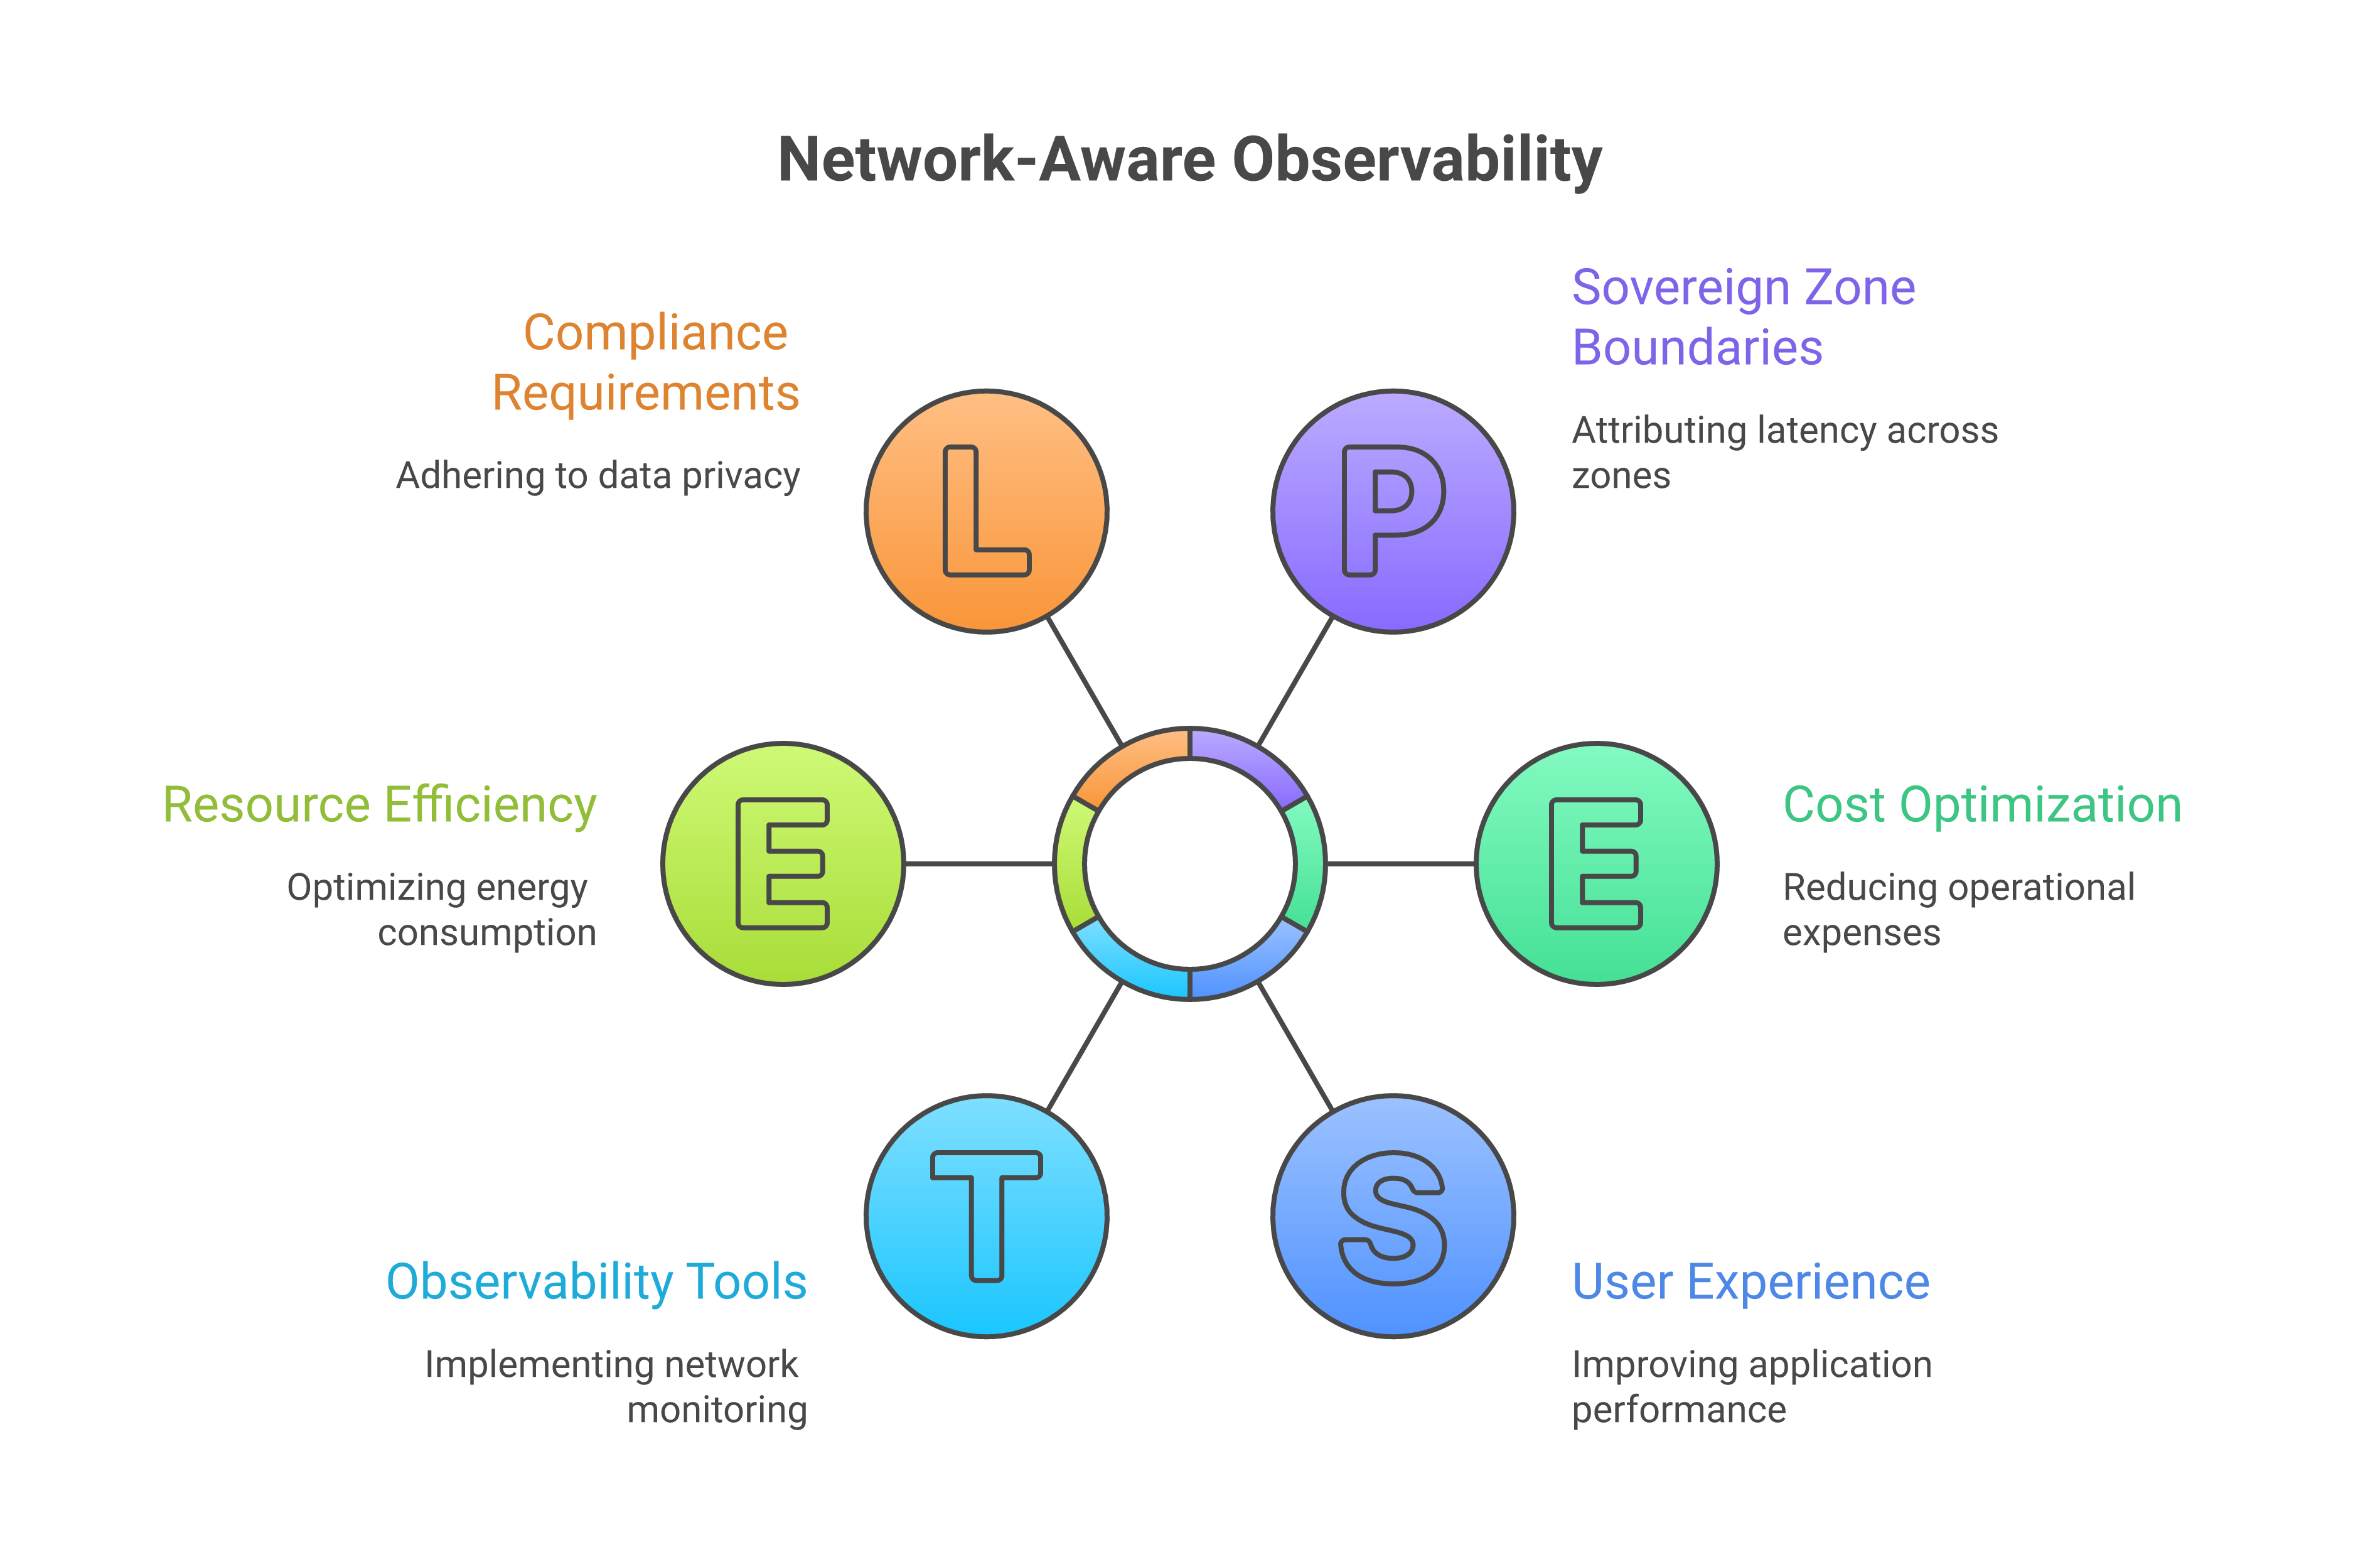
Network‑aware observability also supports the detection of anomalous data flows—a category of compliance risk that is distinct from application errors. If a service that should only communicate within a sovereign zone is observed establishing connections to endpoints outside that zone, the topology model will record that path, and alerting rules can be configured to flag it immediately. This capability effectively makes the observability plane a continuously operating sovereignty assurance mechanism, not just an operational tool. It transforms what would otherwise be a periodic audit activity—checking that network policies match the declared architecture—into a continuous, automated control.
7.6 Observing AI and agents as first‑class citizens
7.6.1 Why AI agents demand first‑class observability treatment
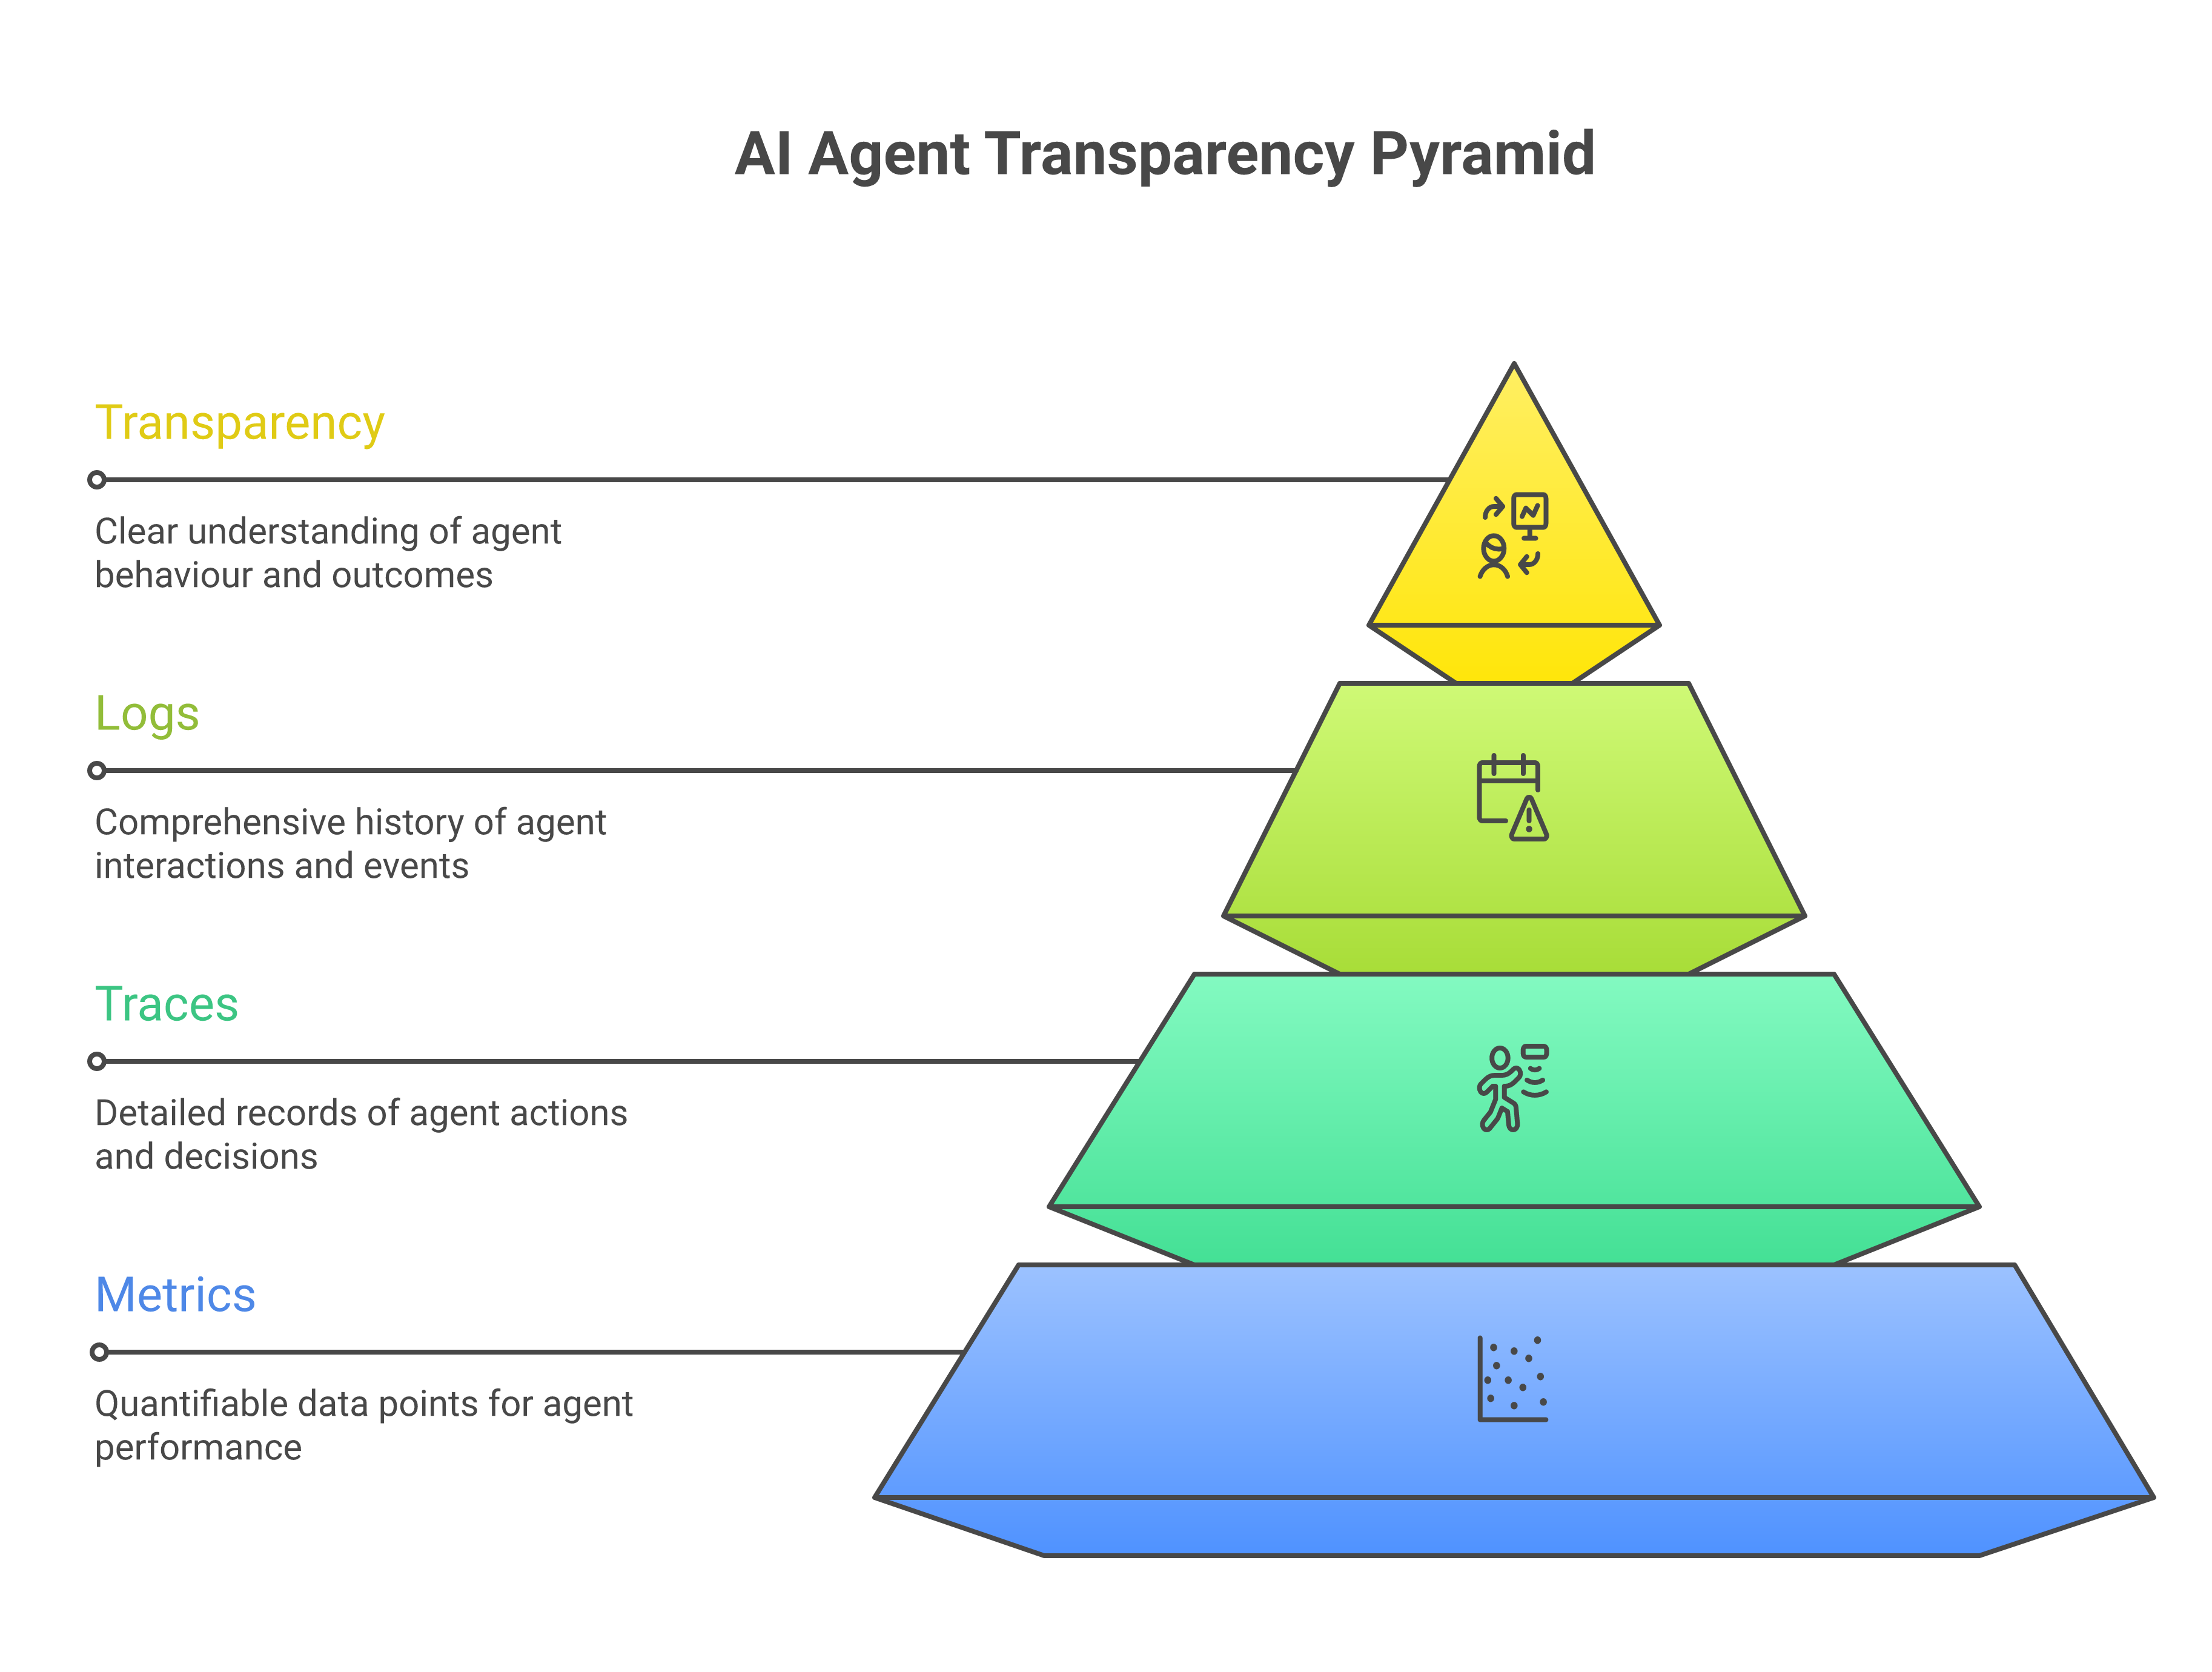
As AI models and agents become part of the operational fabric—detecting anomalies, recommending actions, even executing workflows—they themselves must be observed [14]. The inclusion of AI as a first‑class observability subject is not optional in a sovereign architecture. An AI agent that executes infrastructure changes, initiates failover procedures, or recommends configuration adjustments is, from a governance perspective, an actor in the operational process whose actions must be as accountable as those of human operators. If the observability plane can reconstruct what a human operator did, when, and with what effect, it must be able to do the same for an AI agent.
This requirement is reinforced by regulatory expectations. DORA’s requirements for ICT incident management [2] do not carve out an exception for automated decision‑makers. GDPR’s accountability principle [3] requires organisations to demonstrate that processing operations conform to the regulation, regardless of whether those operations are executed by humans or software. AI governance frameworks—including those published by the European AI Office in the context of the EU AI Act—increasingly require that high‑stakes automated decisions be logged and explainable [15]. The observability architecture is the technical mechanism through which these obligations are met for AI‑driven operations.
7.6.2 Metrics for agent health
A sovereign observability platform monitors AI agents using a set of metrics that capture both operational health and governance‑relevant behaviour. These metrics are distinct from the infrastructure metrics that describe the health of the compute resources on which agents run; they describe the behavioural health of the agent as an autonomous actor.
Task completion rate measures the proportion of assigned tasks that an agent completes successfully, without human intervention or rollback. A declining completion rate may indicate model drift, an increase in environmental complexity, or a policy configuration that is generating excessive refusals. Latency measures the time from task assignment to completion, which is relevant both for operational SLOs and for detecting degradation in the underlying model or its tool integrations. Escalation rate measures how frequently an agent determines that a task exceeds its confidence threshold or authority boundary and escalates to a human operator. A high escalation rate may indicate that the agent’s policy configuration is poorly tuned, or that it is being assigned tasks outside its designed scope [1].
Policy violation rate measures how frequently the agent’s proposed actions are blocked by policy guardrails before execution—a forward‑looking signal that reveals misalignment between agent behaviour and policy intent before the misalignment has operational consequences. Human override rate measures how frequently a human operator modifies or cancels an agent‑proposed action after it has been presented for approval. This metric is particularly valuable: a high override rate in a specific scenario is a direct indicator that the agent’s reasoning is not aligned with human judgement in that context, and it should trigger a review of the agent’s training data, policy configuration or tool definitions [5].
7.6.3 Tracing agent actions
Distributed tracing is as applicable to AI agent workflows as it is to microservice architectures, and the OpenTelemetry data model accommodates it directly. When an agent receives a task, it initiates a trace. Each tool call the agent makes—a Terraform plan, an Ansible playbook execution, a query to a knowledge base, an API call to an ITSM platform—is represented as a child span within that trace. The trace context is propagated into each tool call, so that the telemetry produced by the tool (for example, the Terraform provider’s execution logs) can be correlated with the agent trace that initiated it [8].
IBM Instana’s LLM observability capabilities extend this model to the calls an agent makes to large language model inference endpoints [16]. Each model call is captured as a span, with attributes recording the model identifier, prompt token count, completion token count, latency, and any structured output schema used [10]. If the agent makes multiple model calls in the course of resolving a task—for example, an initial reasoning call followed by a tool‑use loop followed by a synthesis call—each is represented as a child span, giving the complete computational genealogy of the agent’s decision.
This tracing capability transforms the AI agent from an opaque decision‑maker into an observable process. When an agent‑initiated action produces an unexpected outcome, the trace provides the chain of reasoning, tool calls and model responses that led to it. This is not merely useful for debugging; it is the evidentiary foundation for the explainability requirements that AI governance frameworks impose [15].
7.6.4 Drift detection and the sovereign AI record
AI model behaviour is not static. A model that performs well on the distribution of inputs it was trained and evaluated on may degrade as the distribution of real‑world inputs shifts over time—a phenomenon known as concept drift [6]. In an operational AI context, drift may manifest as a gradual increase in escalation rate, a decline in task completion rate, or a systematic shift in the distribution of model outputs (for example, a model that previously recommended a balanced mix of remediation approaches beginning to favour one approach disproportionately).
Detecting drift requires monitoring the distribution of model outputs over time, not merely individual output values. Statistical process control techniques—control charts, sequential probability ratio tests—can be applied to the stream of agent metrics to detect when behaviour has shifted beyond normal variation. The observability platform must therefore support not just the storage of agent metrics but their analysis over time horizons appropriate to the expected rate of drift, which may be weeks or months rather than the minutes relevant to infrastructure alerting.
The sovereign AI record concept addresses the need to maintain a durable, tamper‑evident log of AI agent actions and the model decisions that produced them, scoped to a sovereign zone. Rather than relying on the general observability store (which may have retention policies governed by operational rather than governance requirements), the sovereign AI record is a purpose‑built audit log—hosted within the IBM Sovereign Core boundary to ensure zone‑local retention and tamper‑evident storage [17]—that captures, for each agent action: the task identifier, the agent identity, the model version, the policy version, the reasoning trace (at the appropriate level of abstraction), the action taken, the approval status (automated or human), and the outcome. This record is retained for the full period required by applicable regulations and is protected against deletion or modification by the same controls that protect other compliance evidence. The sovereign AI record is developed fully in Chapter 23, where its relationship to AI explainability, audit and regulatory reporting is examined in detail.
7.7 Observability as evidence
Finally, observability in a sovereign architecture is not only a tool for engineers; it is a source of evidence for auditors, regulators and internal assurance functions.
When regulators ask how an organisation handles incidents, they increasingly expect more than policy documents. They want to see how quickly issues are detected, how they are triaged and prioritised, how decisions are made about remediation, how actions are executed and verified, and how lessons are captured and used to improve. DORA is explicit in requiring that financial entities document their incident response processes and maintain the logs necessary to demonstrate compliance with response time objectives [2].
A well‑designed observability plane can provide this evidence. Traces, logs and metrics show when symptoms first appeared and when responses were initiated [1]. Topology views show which services were affected and which routes were taken. Agent and workflow telemetry show which remediation steps were executed, by whom or by what, and with what effect [13]. The combination produces a coherent, chronologically ordered account of an incident from first symptom to resolution—the kind of account that a regulator examining resilience capability or an internal audit function examining change risk can use to form a view without requiring the operations team to reconstruct events from fragmented records.
Similarly, observability data can demonstrate compliance with sovereignty commitments. Logs may show that certain classes of data were only ever accessed from within a particular sovereign zone, or that certain cross‑zone paths were never used for sensitive traffic. Network telemetry can show that critical services failed over within a region rather than to non‑compliant locations [12]. The topology model can demonstrate that the actual service communication pattern matches the declared architecture—a claim that is otherwise difficult to make with confidence in a dynamic, auto‑scaling environment.
To fulfil this evidentiary role, observability data must be retained and protected appropriately. NIST SP 800‑92 [4] recommends that organisations define log retention requirements based on regulatory obligations, operational needs and the nature of the data. Short retention periods or ad‑hoc deletion may undermine the ability to reconstruct incidents. On the other hand, indefinite retention without governance may create privacy and security risks, as the GDPR storage limitation principle makes clear [3]. The observability architecture must therefore balance operational and regulatory needs, guided by data protection principles, and enforce that balance automatically through storage tier configuration rather than relying on manual process.
7.8 Key takeaways
- Observability must be treated as a sovereignty‑aware discipline from the outset, not an afterthought: where telemetry is stored and who can access it are governance decisions with legal consequences under GDPR [3] and DORA [2], not merely operational preferences.
- The distinction between monitoring (known unknowns) and observability (unknown unknowns) is fundamental: a sovereign architecture requires the capacity to ask arbitrary questions of system state, including questions that were not anticipated when the system was designed [5].
- The three conventional pillars of telemetry—metrics, logs and traces—must be supplemented with events and topology to provide the contextual signals needed for sovereign operations; the OpenTelemetry data model [8] provides a vendor‑neutral foundation for collecting and correlating all five signal types.
- Telemetry data is regulated data: GDPR Article 5(1)(c) data minimisation [3] applies to log records and trace attributes just as it applies to primary business data, and the OpenTelemetry Collector pipeline is the natural enforcement point for scrubbing, masking and jurisdiction‑constrained routing.
- The sovereignty‑aware observability plane is structured in three tiers—zone‑local collector, zone‑local aggregation and cross‑zone federation—with the principle that raw telemetry remains within its zone of origin and only aggregated or derived data crosses zone boundaries.
- The dual‑layer pattern retains native cloud monitoring tools (CloudWatch, Azure Monitor, GCP Cloud Monitoring) for deep platform diagnosis whilst using the federated plane for cross‑cloud correlation and sovereign governance; the most costly incidents — cross‑boundary failures — are precisely those that native tools cannot diagnose alone.
- AI agents are first‑class observability subjects: their task completion rates, escalation rates, policy violation rates and human override rates must be monitored as rigorously as infrastructure metrics, and their actions must be traceable through the same distributed tracing infrastructure that covers microservice requests [8].
- The observability plane is a primary source of regulatory evidence: it provides the chronological record of incidents, responses and agent actions that DORA requires financial entities to maintain, and its design must account for the tension between DORA evidence retention and GDPR storage limitation.
Bridge to Chapter 8 — Network Observability and Performance
This chapter has established that observability in a sovereign cloud environment is not a passive monitoring capability but an active, multi‑layered architecture that enforces data governance, supports regulatory compliance and makes AI behaviour transparent. We have traced the conceptual journey from threshold‑based monitoring through the three‑pillar telemetry model to the five‑signal contextual observability framework—metrics, logs, traces, events and topology—that sovereign operations demands. The OpenTelemetry data model and OTLP protocol provide the standardised, vendor‑neutral instrumentation substrate; the OpenTelemetry Collector provides the zone‑local enforcement point for data minimisation, jurisdiction‑constrained routing and cross‑boundary control. The three‑tier architecture—collector, aggregation and federation—realises the principle that raw telemetry belongs to its zone, whilst derived and aggregated views can be shared safely across boundaries. AI agents have been positioned as first‑class observability subjects, with their own metrics, traces and the durable sovereign AI record introduced as the governance anchor for agentic behaviour.
Chapter 8 deepens one dimension of this architecture: network observability. Where this chapter has treated the network as a context for understanding distributed service behaviour, Chapter 8 examines it directly—the tools, protocols and data models for observing network paths, flow data and protocol behaviour across the zero‑copy, multi‑cloud substrate that sovereign operations depends upon. Network observability raises its own sovereignty considerations: flow records, packet captures and network telemetry may be as sensitive as application logs, and the same principles of zone‑local collection, data minimisation and jurisdictional routing apply with equal force. The techniques and architecture patterns introduced here form the foundation on which Chapter 8 builds.
References
[1] B. Beyer, C. Jones, J. Petoff and N. R. Murphy, Site Reliability Engineering: How Google Runs Production Systems. Sebastopol, CA: O’Reilly Media, 2016. [Online]. Available: https://sre.google/sre-book/table-of-contents/
[2] European Parliament and Council of the European Union, “Regulation (EU) 2022/2554 of the European Parliament and of the Council of 14 December 2022 on digital operational resilience for the financial sector and amending Regulations (EC) No 1060/2009, (EU) No 648/2012, (EU) No 600/2014, (EU) No 909/2014 and (EU) 2016/1011 (DORA),” Official Journal of the European Union, vol. L 333, pp. 1–79, 27 Dec. 2022. [Online]. Available: https://eur-lex.europa.eu/legal-content/EN/TXT/?uri=CELEX:32022R2554
[3] European Parliament and Council of the European Union, “Regulation (EU) 2016/679 of the European Parliament and of the Council of 27 April 2016 on the protection of natural persons with regard to the processing of personal data and on the free movement of such data, and repealing Directive 95/46/EC (General Data Protection Regulation),” Official Journal of the European Union, vol. L 119, pp. 1–88, 4 May 2016. [Online]. Available: https://eur-lex.europa.eu/legal-content/EN/TXT/?uri=CELEX:32016R0679
[4] K. Kent and M. Souppaya, “Guide to Computer Security Log Management,” National Institute of Standards and Technology, Gaithersburg, MD, NIST Special Publication 800-92, Sep. 2006. [Online]. Available: https://csrc.nist.gov/pubs/sp/800/92/final
[5] C. Majors, L. Fong-Jones and G. Miranda, Observability Engineering: Achieving Production Excellence. Sebastopol, CA: O’Reilly Media, 2022.
[6] M. Kleppmann, Designing Data-Intensive Applications: The Big Ideas Behind Reliable, Scalable, and Maintainable Systems. Sebastopol, CA: O’Reilly Media, 2017.
[7] Prometheus Authors, “Prometheus: Monitoring system and time series database,” CNCF Graduated Project, 2012–present. [Online]. Available: https://prometheus.io/docs/introduction/overview/. [Accessed: Feb. 2026].
[8] OpenTelemetry Authors, “OpenTelemetry Specification,” Cloud Native Computing Foundation, v1.x, 2019–present. [Online]. Available: https://opentelemetry.io/docs/specs/otel/. [Accessed: Feb. 2026].
[9] CNCF Technical Advisory Group for Observability, “Observability Whitepaper,” Cloud Native Computing Foundation, v1.0.1, 2023. [Online]. Available: https://github.com/cncf/tag-observability/blob/main/whitepaper.md. [Accessed: Feb. 2026].
[10] IBM Corporation, “Getting started with Instana,” IBM Instana Observability Documentation, release 1.x. [Online]. Available: https://www.ibm.com/docs/en/instana-observability/. [Accessed: Feb. 2026].
[11] World Wide Web Consortium (W3C), “Trace Context,” W3C Recommendation, 23 Nov. 2021. [Online]. Available: https://www.w3.org/TR/trace-context/. [Accessed: Feb. 2026].
[12] IBM Corporation and Amazon Web Services, “Reduce network costs and secure observability with IBM Instana and AWS PrivateLink,” AWS Partner Network Blog, 2023. [Online]. Available: https://aws.amazon.com/blogs/ibm-redhat/reduce-network-costs-and-secure-observability-with-ibm-instana-and-aws-privatelink/. [Accessed: Feb. 2026].
[13] NAND Research, “IBM Updates Concert Platform,” Research Note, 2024. [Online]. Available: https://nand-research.com/research-note-ibm-updates-concert-platform/. [Accessed: Feb. 2026].
[14] IBM Corporation, “Governing AI with IBM,” watsonx.governance Documentation. [Online]. Available: https://www.ibm.com/docs/en/watsonx/saas?topic=governing-ai. [Accessed: Feb. 2026].
[15] European Commission, “Regulation (EU) 2024/1689 of the European Parliament and of the Council of 13 June 2024 laying down harmonised rules on artificial intelligence (Artificial Intelligence Act),” Official Journal of the European Union, vol. L, 12 Jul. 2024. [Online]. Available: https://eur-lex.europa.eu/legal-content/EN/TXT/?uri=CELEX:32024R1689
[16] D. Hiraoka, “Instana: Introduction to LLM Observability — New Architecture,” IBM Community Blog, 4 Feb. 2026. [Online]. Available: https://community.ibm.com/community/user/blogs/daisuke-hiraoka2/2026/02/04/instana-introduction-to-llm-observability-new-arch. [Accessed: Feb. 2026].
[17] IBM Corporation, “Introducing IBM Sovereign Core: A new software foundation for sovereignty,” IBM Newsroom, 2024. [Online]. Available: https://www.ibm.com/new/announcements/introducing-ibm-sovereign-core-a-new-software-foundation-for-sovereignty. [Accessed: Feb. 2026].
[18] U.S. Department of Health and Human Services, “Security Standards: Technical Safeguards,” HIPAA Security Rule, 45 CFR § 164.312, 2013. [Online]. Available: https://www.hhs.gov/hipaa/for-professionals/security/laws-regulations/index.html
[19] European Parliament and Council of the European Union, “Regulation (EU) 2017/745 on medical devices (EU MDR),” Official Journal of the European Union, vol. L 117, pp. 1–175, May 2017. [Art. 83–86: Post-market surveillance obligations.] [Online]. Available: https://eur-lex.europa.eu/legal-content/EN/TXT/?uri=CELEX:32017R0745
[20] European Parliament and Council of the European Union, “Directive (EU) 2022/2464 amending Regulation (EU) No 537/2014, Directive 2004/109/EC, Directive 2006/43/EC and Directive 2013/34/EU, as regards corporate sustainability reporting (CSRD),” Official Journal of the European Union, vol. L 322, pp. 15–80, Dec. 2022. [Online]. Available: https://eur-lex.europa.eu/legal-content/EN/TXT/?uri=CELEX:32022L2464
[21] Amazon Web Services, “Amazon CloudWatch Documentation,” AWS. [Online]. Available: https://docs.aws.amazon.com/cloudwatch/. [Accessed: Feb. 2026].
[22] Microsoft Corporation, “Azure Monitor Documentation,” Microsoft Learn. [Online]. Available: https://learn.microsoft.com/en-us/azure/azure-monitor/. [Accessed: Feb. 2026].
[23] Google Cloud, “Cloud Monitoring Documentation,” Google Cloud. [Online]. Available: https://cloud.google.com/monitoring/docs. [Accessed: Feb. 2026].
Sovereign Cloud Operations: AI-Driven Management of Sovereign Estates
© 2026 by Alan Hamilton
is licensed under CC BY-SA 4.0


