Chapter 8 — Network Observability and Performance in Zero‑Copy Architectures
Summary
This chapter elevates the network from invisible utility to first-class risk and control surface, arguing that in a zero-copy, multi-cloud architecture every cross-region query and event flow depends on specific paths whose performance and jurisdictional compliance directly determine whether the estate is operationally viable. It defines network service-level objectives with explicit latency, loss, jitter and bandwidth targets, augmented by a jurisdiction predicate that ensures SLOs are only meaningful on paths that themselves respect sovereignty constraints. The chapter surveys the full instrumentation stack — IPFIX flow records, eBPF-based observability via Cilium and Hubble, Istio service mesh telemetry and synthetic probing — and shows how these layers combine to transform the network from a black box into an observable, auditable fabric. Architects will find guidance on establishing baselines using Concert historical telemetry, applying error budgets to network SLOs, and integrating network signals into agentic remediation workflows that respect both performance and sovereignty requirements.
8.1 Why the network becomes a first‑class risk
In many organisations, the network has historically been treated as a mostly invisible utility: if pings succeed and basic health checks pass, attention gravitates toward applications, databases and security tools. In a sovereign, zero‑copy, multi‑cloud world, that posture is no longer viable. When systems depend on live, in‑place access to data across regions and providers, the network is the integration fabric rather than just “plumbing.” The gravity of large datasets and the latency sensitivity of real‑time access means that network performance directly determines whether the architecture is operationally feasible or merely theoretically sound [1].
Every cross‑region query, every call to a system of record in another cloud, every event traversing an event mesh relies on specific paths whose behaviour directly affects user experience and business outcomes. At the same time, sovereignty adds constraints: it is not enough for paths to be fast; they must also route traffic along permitted routes, respecting data residency and jurisdictional boundaries [2]. A path that improves latency by 20 ms but routes EU personal data through a non‑EU backbone is not an optimisation — it is a compliance failure.
Treating the network as a first‑class risk and control surface means acknowledging that latency, jitter, throughput and loss on key paths are as important as CPU and memory on key services; that routing policies and connectivity patterns are part of the organisation’s sovereignty posture, not just technical configuration; and that network observability is essential not only for performance but also for compliance evidence. The NIST guidance on Information Security Continuous Monitoring [3] makes clear that monitoring scope must encompass network connectivity and behaviour, not only endpoint and application signals. That imperative is sharper still in architectures where the network is the medium through which all integration occurs.
Executive Perspective
In a zero-copy architecture, the network is no longer background plumbing — it is the medium through which every business transaction, every data access and every compliance-critical event flow must travel. When network performance degrades or when traffic inadvertently crosses a jurisdictional boundary, the consequences are immediate: revenue-generating services slow or fail, and sovereignty commitments made to regulators and customers are breached. For the CIO, network observability is therefore inseparable from business continuity and regulatory risk management. Defining explicit network service-level objectives, instrumenting every critical path, and maintaining the ability to prove that data never left its permitted jurisdiction are the operational foundations on which the credibility of a multi-cloud sovereign strategy rests. The alternative — discovering a routing violation during a regulatory examination or a latency problem through customer complaints — carries costs that dwarf the investment in proper network instrumentation.
8.2 What “good” looks like for sovereign network behaviour
8.2.1 Defining network SLOs
To operate a zero‑copy estate safely, you need a shared and precise definition of “good” network behaviour for each critical path. The most useful form for such a definition is the network service‑level objective (SLO): an explicit, measurable target for a specific path between two named endpoints, defined in terms of the metrics that actually determine whether applications and business processes can meet their own commitments.
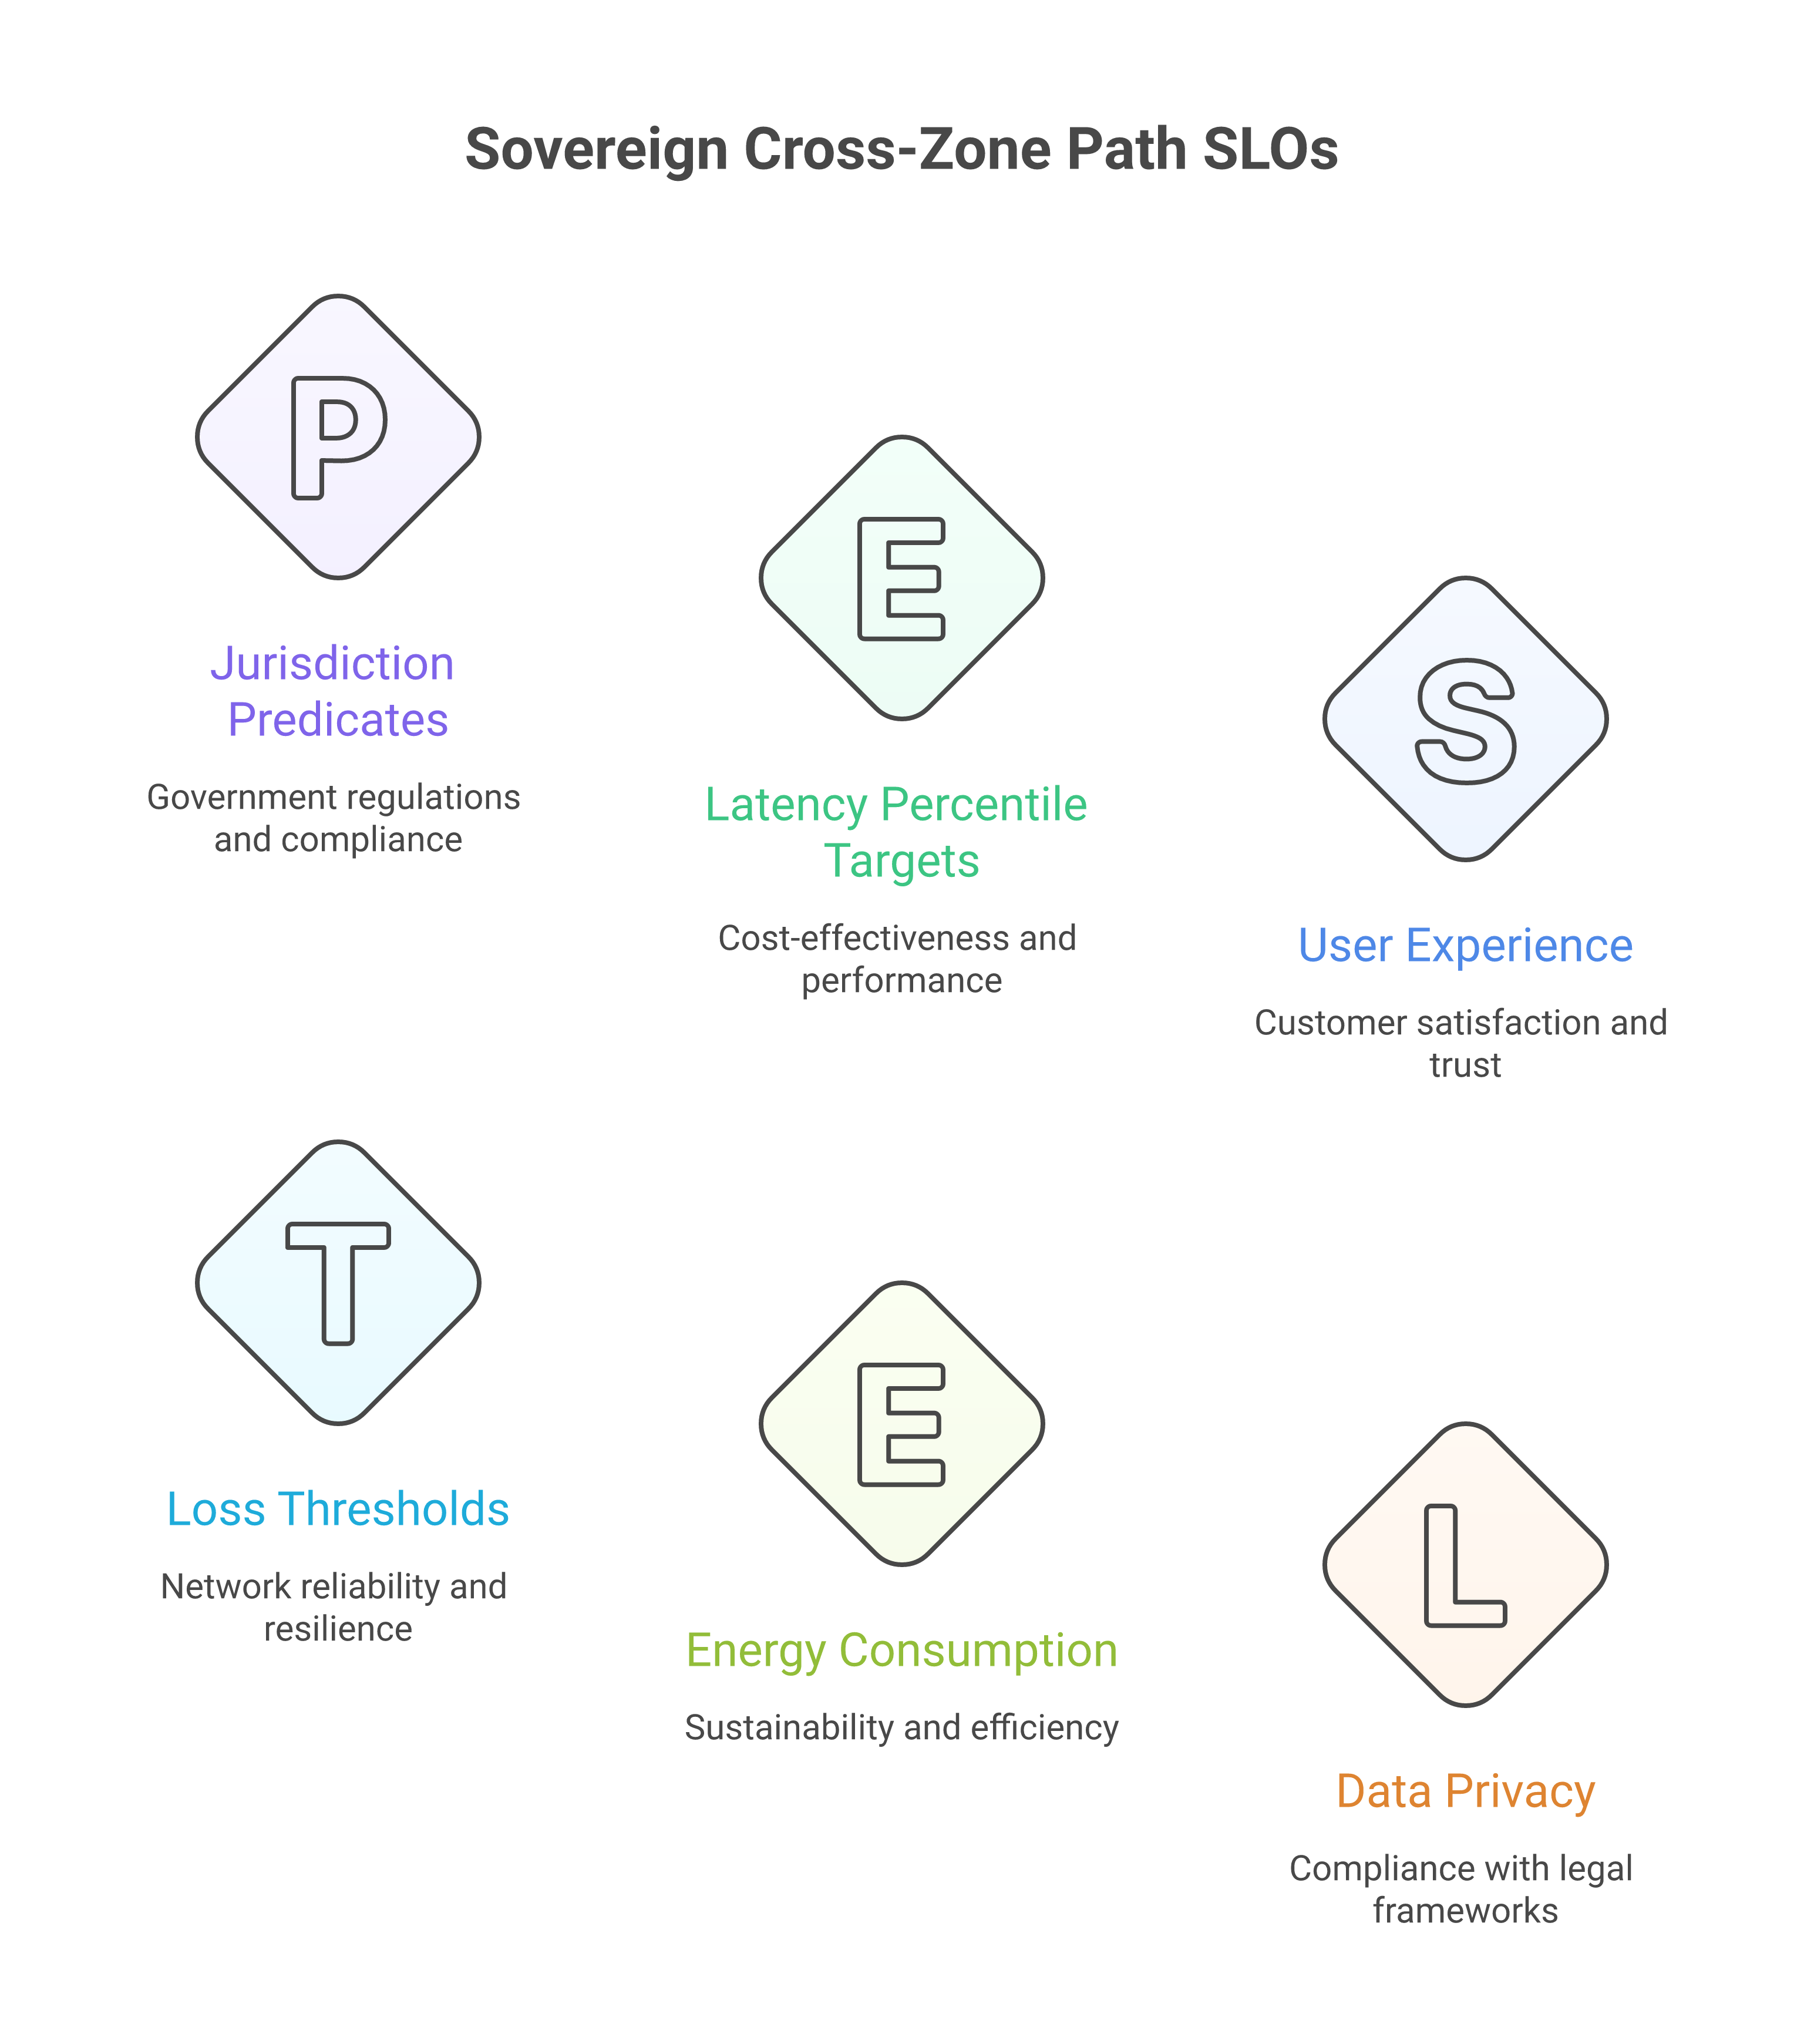
The primary metrics for network SLOs in a zero‑copy sovereign estate are the following. Latency is expressed as end‑to‑end round‑trip time for traffic between two points, and must be characterised statistically rather than as a single average. The percentile model advocated by Beyer et al. in Site Reliability Engineering [4] is the appropriate basis: a p50 target describes typical behaviour; a p95 target controls the experience of most users and transactions; a p99 target protects against the long tail that often determines satisfaction for real‑time and financial workloads. For a typical cross‑zone path within a sovereign estate, p50 targets might sit at 5–15 ms, with p95 at 20–30 ms and p99 at 50–80 ms, though the right numbers must be derived from measurement and from the latency budget imposed by the application’s own SLOs. Allocating a fixed proportion of the user‑facing latency budget to each network segment — typically no more than 30–40% — prevents the network from consuming headroom that applications need.
Packet loss is expressed as the fraction of transmitted packets that are dropped or corrupted in transit. Even small loss rates have disproportionate effects on TCP‑based protocols, which respond by entering congestion avoidance, halving effective throughput and introducing retransmission delays. For critical paths, a target of less than 0.01% packet loss is reasonable; paths that exhibit sustained loss above 0.1% will degrade TCP throughput noticeably and introduce visible jitter into any protocol that depends on steady delivery. Jitter — the statistical variance in one‑way or round‑trip latency — is especially important for time‑sensitive protocols such as those used in real‑time analytics, streaming replication and event delivery. High jitter makes it difficult to set appropriate timeouts: too tight, and false timeouts proliferate; too loose, and genuinely failed calls are not detected promptly. Bandwidth utilisation is typically expressed as mean and peak utilisation against the provisioned capacity of each link. A link consistently utilised above 70–80% of its capacity will exhibit queuing‑induced latency and will have insufficient headroom to absorb traffic spikes. Error rates — TCP connection resets, TLS handshake failures, DNS resolution errors — round out the picture, capturing failure modes that packet loss alone does not expose.
8.2.2 The sovereignty dimension
Zero‑copy architectures amplify the importance of these characteristics. A single user request may involve multiple in‑place reads and writes plus the emission and consumption of events. Any degradation on the paths between components will be visible in response times and error rates. Unlike batch‑oriented systems, there is little buffer: problems are felt in real time [5][22].
The sovereignty dimension adds a requirement that purely performance‑oriented SLOs do not capture: where traffic flows matters as much as how well it flows. An SLO that says “p99 latency for EU‑zone to EU‑zone calls must be below 80 ms” is incomplete if it does not also state that traffic must not traverse links outside EU jurisdiction, regardless of whether doing so would improve latency. In practice, this means that the routing plane — BGP policies, traffic engineering rules, cloud provider routing configurations — must be co‑designed with the observability plane so that every deviation from the permitted topology is both prevented by policy and detected and evidenced by telemetry. Paths involving personal or regulated data may be required to stay within specific regions or under specific operators. Even if a path via a foreign backbone would offer lower latency, using it might breach commitments made to data subjects and regulators [2]. Network SLOs in a sovereign estate therefore carry a jurisdiction predicate: the latency and loss targets are only meaningful if they are measured on paths that are themselves compliant.
8.2.3 Establishing baselines using Concert historical telemetry
Defining realistic SLO targets requires baseline data — empirical measurements of how the network actually behaves under representative load, not theoretical point‑to‑point benchmarks conducted in isolation. IBM Concert’s historical telemetry ingestion [6] provides the mechanism for establishing these baselines across the estate. Concert aggregates performance signals from multiple observability backends and correlates them with the topology graph it maintains, allowing architects to query historical latency distributions for specific service‑to‑service or zone‑to‑zone paths, to identify the times of day and load conditions under which tails widen, and to detect gradual trend degradation that would not trigger any individual alert but that indicates a path approaching its capacity limit.
Baselines established through this process are the ground truth against which SLO targets are set. A p99 latency target set without baseline data is either so conservative that it fires constantly, generating alert fatigue, or so loose that it fails to protect user experience. Baselines also define the starting point for error budget calculations.
8.2.4 Error budgets for network SLOs
The error budget concept from the SRE discipline [4] applies directly to network SLOs. If a latency SLO specifies that p99 latency for a critical path must be below 80 ms for 99.9% of the rolling 30‑day window, then the error budget for that path is 0.1% of the measurement window — approximately 43 minutes per month during which the SLO may be violated without consequence. An error budget makes the cost of unreliability concrete: it converts an abstract performance goal into a finite, consumable resource. When the error budget for a network path is being consumed at an elevated rate — perhaps because a recent infrastructure change has increased tail latency — it creates a natural pressure to investigate and remediate before the budget is exhausted, rather than waiting for a more dramatic failure. In sovereign operations, error budgets also discipline the trade‑off between performance improvement and stability: experimental topology changes that might reduce latency but risk consuming the error budget must be weighed against the budget remaining for the period.
8.3 Instrumenting the network: from black box to observable fabric
Traditional network tooling focuses on devices: routers, switches, firewalls. It collects interface counters, CPU stats and flow summaries via mechanisms such as SNMP and NetFlow. While valuable, these views are often disconnected from application behaviour. They tell you that a link is busy, not which business process is suffering.
Modern observability extends into the network by correlating service‑level telemetry with network‑level behaviour. Application performance monitoring and distributed tracing show how much time each request spends in the application code, in dependent services, and waiting on network calls. By tying traces to topology, teams can see which segments of a path are responsible for delays or errors — for example, discovering that cross‑cloud calls between a front‑end and back‑end consistently add 80 ms of latency while local calls are fast [7].
8.3.1 Flow‑based monitoring: NetFlow, IPFIX and sFlow
The most established approach to network traffic metadata collection is flow‑based monitoring, in which network devices and virtual infrastructure summarise observed traffic into per‑flow records that describe which endpoints communicated, how much data was exchanged, and over what time interval. Three principal standards are in common use.
NetFlow v9, specified in RFC 3954 [8], was developed by Cisco as a template‑based flow export format. Its template mechanism allows network equipment to define custom record formats, making it flexible for different deployment contexts. Flow records include source and destination IP addresses, port numbers, protocol, byte and packet counts, and interface identifiers. NetFlow v9 is supported by most enterprise routing and switching equipment and by major virtualisation platforms. Its principal limitation is that it is proprietary to Cisco in origin, which created interoperability difficulties in multi‑vendor environments.
IPFIX — IP Flow Information Export, defined in RFC 7011 [9], is the IETF standardisation of the flow export concept, building directly on NetFlow v9’s template model. IPFIX provides a formally specified, vendor‑neutral wire format for flow records and a standardised Information Element registry [10] that ensures semantic consistency across implementations. In a multi‑cloud, multi‑vendor sovereign estate, IPFIX is the preferred standard because it enables a single collection infrastructure to receive records from cloud provider VPC flow exporters, physical network equipment, virtual switches and container networking planes without requiring per‑vendor parsing logic. IPFIX flow records are particularly valuable for sovereignty compliance evidence: they provide a time‑stamped record of which IP ranges communicated, allowing post‑hoc verification that traffic stayed within permitted boundaries.
sFlow, maintained by the sFlow.org consortium, takes a different approach: rather than summarising flows, it samples packets at a configurable rate and exports the sampled packet headers alongside interface counter data [11]. sFlow’s statistical sampling makes it suitable for very high‑throughput environments where maintaining per‑flow state in hardware is impractical, but it trades completeness for scalability — low‑volume flows may not appear in the sample. In practice, a sovereign estate will typically deploy IPFIX for comprehensive flow accounting on critical paths and supplement it with sFlow for high‑volume fabric links where sampling is acceptable.
8.3.2 eBPF‑based observability: Cilium and Hubble
Extended Berkeley Packet Filter (eBPF) represents a fundamentally different approach to network observability. Rather than relying on network devices to export summarised flow data, eBPF allows small, verified programmes to be loaded into the Linux kernel and executed at specific instrumentation points — network packet processing, socket operations, system calls — with near‑zero overhead and without requiring kernel module development or application modification [12]. Gregg’s comprehensive treatment in BPF Performance Tools [13] documents how eBPF programmes can capture network events at kernel level, providing visibility into traffic that never appears in traditional flow records because it does not leave the host.
Cilium, a CNCF graduated project [14], uses eBPF to implement container networking, network policy enforcement and observability for Kubernetes environments. Its Hubble component provides a real‑time, flow‑level observability layer built entirely on eBPF instrumentation. Hubble can observe every network flow between pods, namespaces and external endpoints, with full HTTP/gRPC/Kafka request‑level visibility for L7 protocols — capabilities that are invisible to traditional flow‑based monitoring which operates at L3/L4. Hubble exposes this telemetry through a CLI, a web interface and a Prometheus metrics endpoint, and its flow data can be exported to central observability backends for correlation with application traces and infrastructure metrics [14].
In a sovereign Kubernetes estate, Cilium and Hubble provide several capabilities that complement IPFIX‑based flow monitoring. First, they capture intra‑node traffic — communication between pods on the same host — which never traverses a physical network interface and therefore never appears in traditional NetFlow or IPFIX records. Second, because Cilium’s network policy enforcement is also eBPF‑based, the same instrumentation plane that enforces policy also generates the evidence that policy is being enforced: every dropped packet is logged with the policy rule that caused the drop, providing an automatically generated compliance trail. Third, Hubble’s L7 visibility enables service‑to‑service flow mapping at the application protocol level, which is essential for understanding which specific microservice interactions are contributing to latency and which are routing traffic in ways that may not be jurisdictionally compliant.
8.3.3 Service mesh telemetry: Istio and Envoy
Where Cilium and Hubble provide eBPF‑based observability at the kernel and container networking layer, service meshes provide observability at the application protocol layer for service‑to‑service communication. Istio [15] is the most widely deployed service mesh in enterprise Kubernetes environments. It injects an Envoy sidecar proxy alongside each service instance; all inbound and outbound traffic passes through these sidecar proxies, which enforce mutual TLS, apply traffic policies, and emit detailed L7 telemetry without any modification to the application code.
The telemetry emitted by Istio’s Envoy sidecars includes request count, request duration (expressed as a histogram supporting percentile calculation), request size, response size, and response code, broken down by source service, destination service, source sovereign zone and destination sovereign zone. This per‑service‑pair, per‑direction granularity is precisely what network SLO monitoring requires: rather than measuring end‑to‑end latency as an aggregate, Istio’s telemetry allows the latency budget to be decomposed into individual service‑to‑service hops, identifying exactly where latency is being consumed. Istio exports these metrics in Prometheus format, making them available to any Prometheus‑compatible monitoring backend including IBM Instana [7] and to Concert’s signal ingestion pipeline [6].
Istio’s service mesh also provides distributed tracing integration: Envoy proxies propagate standard trace context headers (W3C Trace Context or B3) through the call chain, allowing traces that cross service boundaries to be assembled into end‑to‑end request traces. These traces can be correlated with network flow records and eBPF observations to produce a complete, multi‑layer picture of each request’s journey through the sovereign estate.
8.3.4 Synthetic probing: active connectivity and latency tests
Flow‑based, eBPF‑based and service mesh telemetry are all passive in the sense that they observe traffic as it naturally occurs. In contrast, synthetic probing involves generating controlled test traffic to verify connectivity and measure latency between sovereign zones, independently of whether real user traffic is flowing.
Synthetic probes are particularly valuable for three situations. First, they provide a continuous baseline measurement that is unaffected by variations in real traffic patterns, making it possible to detect path degradation before it affects users. Second, for paths that are used infrequently, passive monitoring may not provide enough data points to evaluate SLO compliance reliably; synthetic probes fill the gap. Third, for new paths established by topology changes, synthetic probing can verify that the path behaves as expected before real traffic is committed to it.
In a sovereign estate, synthetic probes should be placed at the boundaries of each sovereign zone and configured to run at regular intervals — typically every 30–60 seconds — measuring round‑trip latency, packet loss and maximum achievable throughput on each critical inter‑zone path. The probing infrastructure should itself be confined within sovereign boundaries: a synthetic prober that runs from a non‑sovereign management host and whose results are stored outside the zone introduces both a residency risk and a measurement artefact.
At the DNS layer, IBM NS1 Connect [27] provides intelligent traffic steering that complements the path-level observability described above. NS1 Connect’s filter chain architecture evaluates real-time telemetry — latency measurements, endpoint health checks and geographic metadata — at DNS resolution time, directing each client request to the optimal endpoint based on policies that can encode sovereign zone affinity alongside performance criteria. For a sovereign estate, this means that DNS routing policies can enforce jurisdictional constraints as a first-hop decision: a request originating within a European sovereign zone is resolved to an endpoint within that zone by policy, regardless of whether a lower-latency endpoint exists elsewhere. NS1 Connect’s traffic steering decisions also feed observability data back into the network telemetry fabric, providing a DNS-level view of traffic distribution that complements the flow-level and mesh-level views described above.
8.3.5 Packet capture in regulated environments
Full packet capture — recording the complete content of network traffic — provides the deepest possible visibility into network behaviour but carries significant risks in regulated environments. Captured packets may contain personal data, authentication credentials, session tokens or commercially sensitive payload content, any of which may be subject to data protection, professional secrecy or sector‑specific confidentiality obligations.
In practice, full packet capture in a sovereign estate should be restricted to specific, time‑bounded, operator‑authorised investigations of network anomalies that cannot be resolved through flow data, eBPF observations or service mesh telemetry. Where packet capture is used, it should be confined to a dedicated capture environment with strict access controls; captured files should be retained only for the minimum duration necessary for the investigation and then cryptographically wiped; and capture sessions should be logged in the governance and audit plane with full details of who authorised the capture, what was captured and when it was destroyed. Technically, many regulated organisations restrict packet capture to header‑only modes — capturing IP and TCP/UDP headers but not payload — which preserves the ability to diagnose connectivity and routing issues while avoiding personal data capture. This approach is consistent with the data minimisation principle of GDPR Article 5(1)(c) [16] and is an important safeguard when network telemetry is also being retained as compliance evidence.
8.3.6 Regulatory mandates for network monitoring in critical infrastructure
Several sector-specific regulatory frameworks impose explicit network monitoring obligations that go beyond the general-purpose observability patterns described above (see Chapter 3 for the full regulatory landscape). In the transport sector, the US Transportation Security Administration’s Security Directives for pipeline and surface transportation operators mandate continuous monitoring of network segmentation controls and the ability to detect lateral movement between operational technology (OT) and information technology (IT) network segments [25]. Operators must demonstrate that segmentation is not merely configured but actively verified through monitoring, making eBPF-based flow observation and Cilium network policy audit trails directly relevant compliance evidence. In aviation, EASA Part-IS (Information Security) requires organisations within the European aviation safety ecosystem to implement continuous monitoring of their network and information systems, with particular attention to interfaces between safety-critical avionics networks and connected IT infrastructure [26]. For sovereign estates hosting workloads in either of these domains, the network observability architecture must be extended to cover OT/IT boundary flows and must retain network telemetry for the periods and in the formats that sector regulators expect.
8.4 Network‑aware observability in a zero‑copy world
Zero‑copy architectures increase the coupling between network behaviour and application behaviour. A microservice that performs several sequential lookups against a system of record in another region is effectively turning network latency into user‑visible latency. An event‑driven pipeline that crosses zones multiple times amplifies the effect of jitter and loss [5].
Network‑aware observability helps you attribute latency accurately: distinguishing time spent on the wire from time spent in computation informs whether you should optimise code, adjust timeouts or change topology. It allows you to spot path‑specific issues: seeing that calls from zone A to zone B are slow while calls within zone A are fine, or that requests via a particular gateway are degraded, in ways that aggregate dashboards cannot reveal. And it enables you to correlate with changes: recognising that a spike in latency coincided with a routing update, new security policy or change in interconnect usage — a correlation that is only possible when network telemetry is aligned in time and context with the change management record [7].
IBM Instana’s full‑stack observability model supports network‑aware analysis by automatically discovering not only processes and services but also the network paths between them, attributing latency to specific segments and surfacing path‑level metrics alongside application traces [20]. This automatic correlation — which the IBM Instana documentation characterises as a core differentiator of its approach to observability [7] — means that engineers investigating a latency incident see network behaviour and application behaviour in the same interface rather than having to switch between separate tools and reconcile timestamps manually.
In sovereign contexts, network‑aware observability also validates design assumptions. If an architecture assumes that latency between two sovereign zones will be below a certain threshold, observability must verify whether that assumption holds over time. If it does not, the organisation may need to revisit placement, co‑location or even the feasibility of certain real‑time cross‑zone operations. Treating design assumptions as hypotheses to be continuously validated — rather than as facts to be documented and forgotten — is a defining characteristic of mature sovereign operations.
8.5 Data gravity, latency and placement decisions
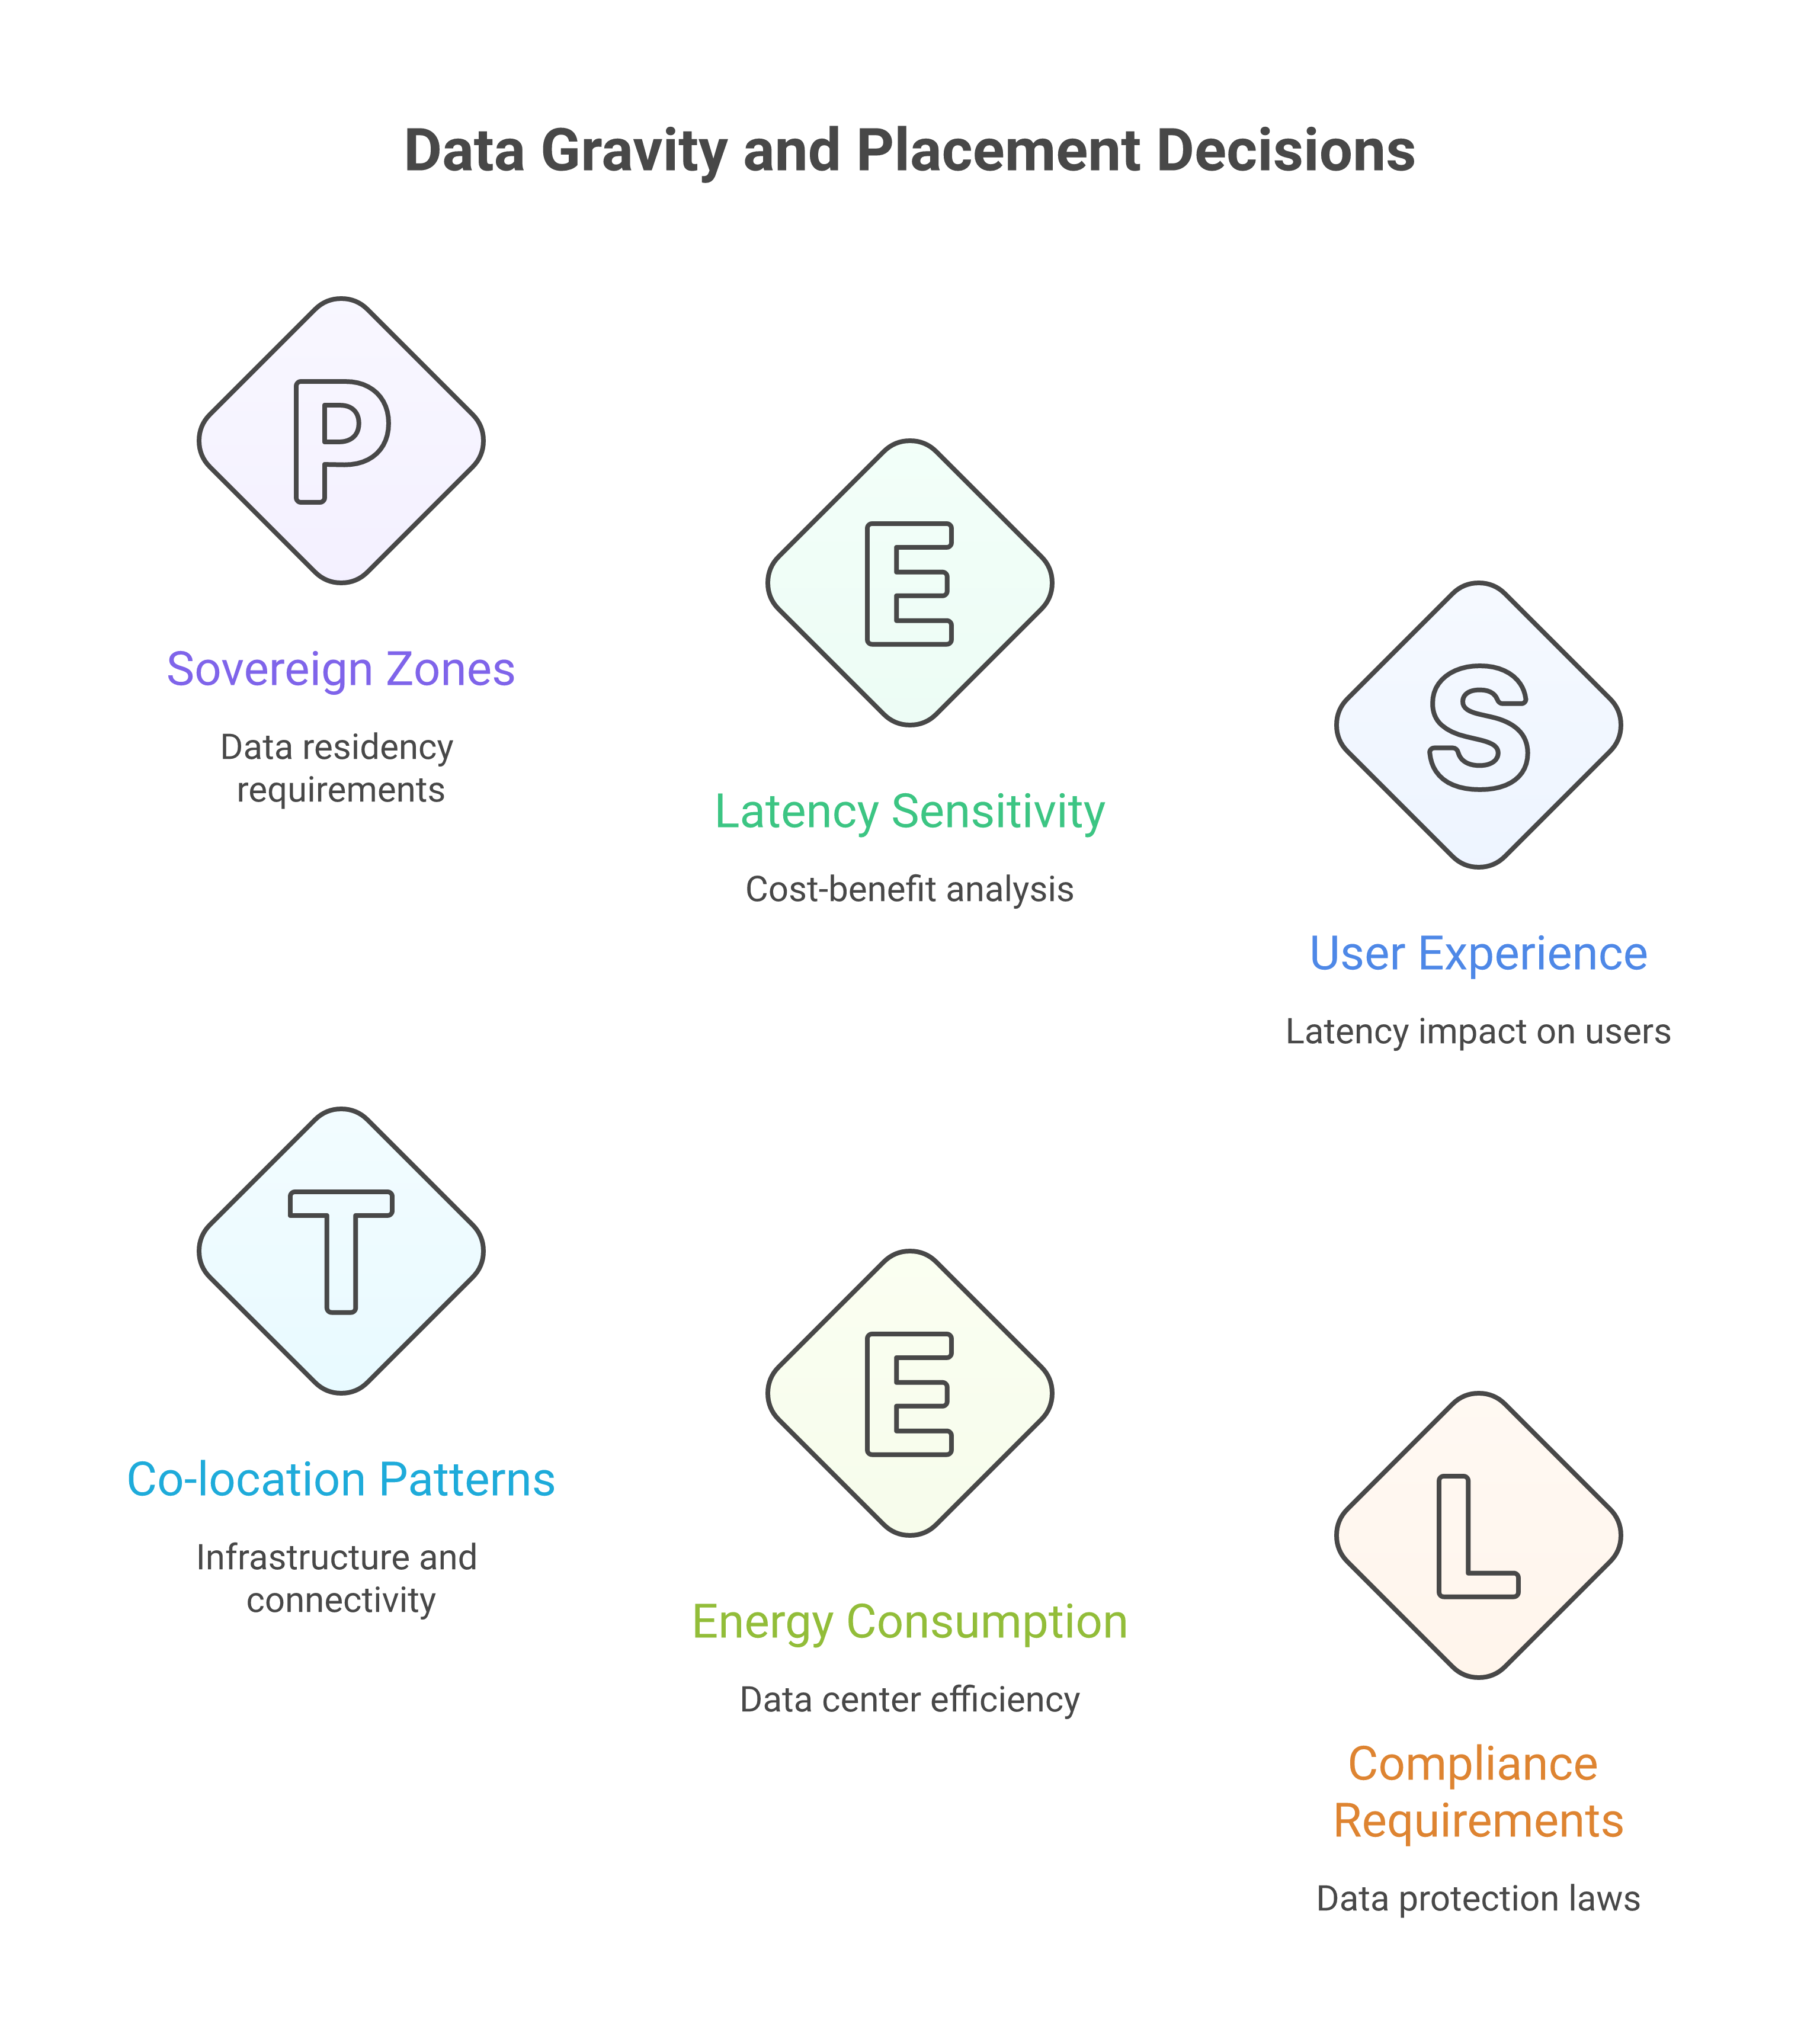
The notion of data gravity — that large datasets attract applications and services toward them — plays a major role in network performance discussions. Moving computation to data is often cheaper and faster than moving data to computation. Zero‑copy architectures, which favour in‑place access, make this effect more visible and more consequential [1].
When a dataset lives in a particular region or provider, and when sovereignty or technical constraints prevent easy replication, applications that need low‑latency access are naturally drawn to run nearby. Attempting to access such data from distant zones or clouds will incur both latency and potential egress charges. Several implications follow for sovereign estates. Co‑location as default means that for chatty, latency‑sensitive interactions, co‑locating services and data in the same zone or tightly coupled zones is usually essential; the SLO analysis described in section 8.2 will rapidly reveal when this principle is being violated. Careful cross‑zone design means that where cross‑zone or cross‑cloud access is unavoidable, architectures must be designed to minimise round‑trips — through caching, batch reads or asynchronous flows — and to tolerate higher latencies gracefully. Placement policies means that placement and scheduling decisions should account for data gravity and network characteristics alongside compute and memory, and that tools treating all regions as equivalent will encounter performance and cost problems that their operators will initially misattribute to application code.
In multi‑cloud sovereign settings, this means topology cannot be an afterthought. Choosing where to place systems of record, analytical stores and services is as much a network and sovereignty decision as it is a capacity decision. Observability feeds back into these decisions by revealing the real behaviour of data‑adjacent paths, providing the empirical foundation for placement reviews that might otherwise rely on intuition or outdated benchmarks.
8.6 Defining and enforcing network SLOs
8.6.1 SLO targets and their operational contracts
Network SLOs turn expectations about path behaviour into explicit operational contracts. For a critical path — for instance, from a front‑end in one zone to a system of record in another — a well‑formed SLO defines a target latency (e.g., p95 below 30 ms), a maximum acceptable loss rate (e.g., below 0.1%) and an availability target for connectivity (e.g., 99.95% per rolling month). These targets should be grounded in realistic measurements from the baseline analysis described in section 8.2.3 and in business needs: if user experience degrades noticeably above 300 ms end‑to‑end, you need to allocate part of that budget to the network and ensure that the network SLO is tight enough to protect the remainder for application and database processing [4].
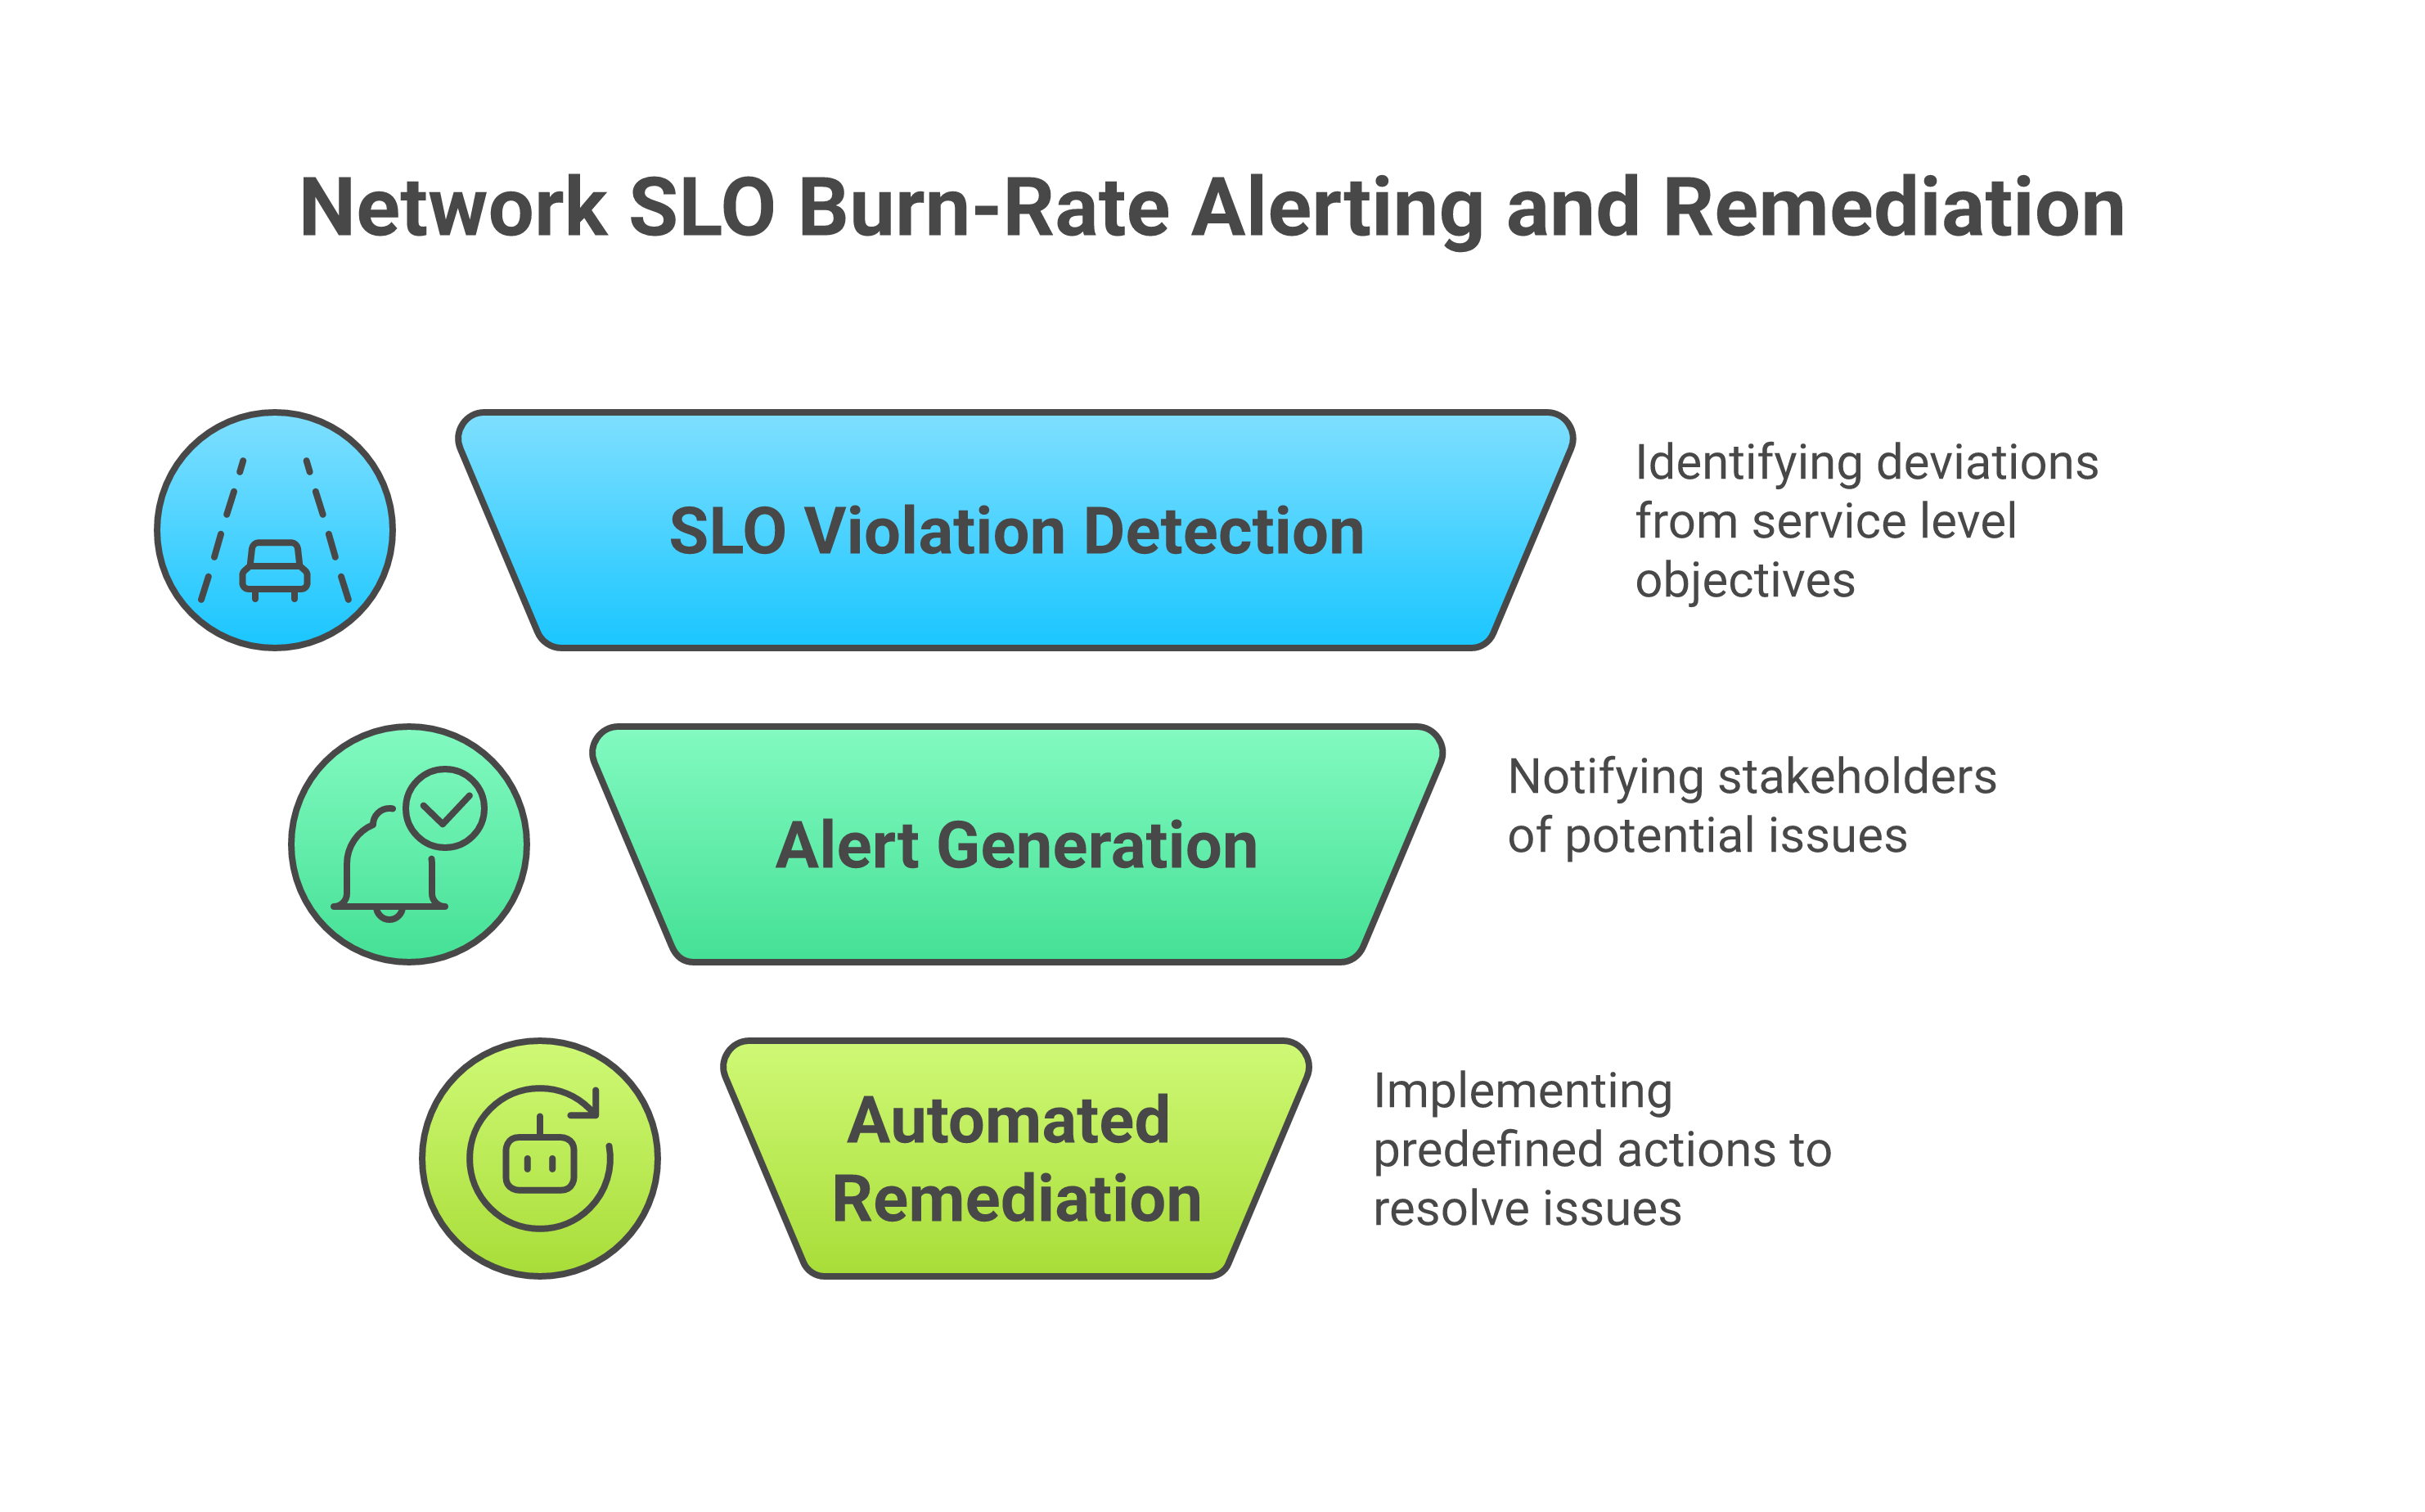
Enforcing network SLOs requires instrumentation and observability able to measure the relevant metrics for the specific paths in question, alerting integrated into the same incident response workflows as application SLO breaches, and automated or agent‑assisted responses when SLOs cannot be met. In sovereign operations, some SLOs carry policy components: an SLO might state not only that latency must be below a certain threshold, but also that traffic must not leave a specified jurisdiction. Violations are thus simultaneously reliability incidents and potential compliance issues, demanding rapid attention from both engineering and risk functions [2].
8.6.2 Multi‑window, multi‑burn‑rate alerting
The alerting approach that accompanies network SLOs should follow the multi‑window, multi‑burn‑rate methodology documented in Chapter 5 of The Site Reliability Workbook [17], which Google’s SRE teams developed to address the two principal failure modes of SLO‑based alerting. A naive alerting rule that fires whenever the SLO is momentarily breached produces too many alerts: short‑lived fluctuations create noise that operators learn to ignore. Conversely, alerting only when the error budget is nearly exhausted provides too little warning: by the time the alert fires, the window to investigate and remediate before budget exhaustion is very short.
The multi‑window approach resolves this by defining alerts at multiple burn rates — the rate at which the error budget is being consumed relative to the budget’s intended depletion rate. A burn rate of 1.0 means the error budget is being consumed at exactly the rate that would exhaust it at the end of the SLO window. A burn rate of 14.4 means the budget would be exhausted in 1/14.4th of the window — approximately two hours for a 30‑day SLO. High burn rate alerts (e.g., burn rate ≥ 14.4 over a 1‑hour and 5‑minute window) detect severe, rapidly developing degradation and demand immediate response. Medium burn rate alerts (e.g., burn rate ≥ 6 over a 6‑hour and 30‑minute window) identify sustained degradation that is less acute but will exhaust the budget if unaddressed. Low burn rate alerts (e.g., burn rate ≥ 3 over a 3‑day and 6‑hour window) surface slow erosion that would not trigger shorter‑window alerts but represents a meaningful trend. Applying this structure to network SLOs means that path degradation is detected and communicated at a severity commensurate with its actual impact on the error budget, rather than generating undifferentiated noise.
8.6.3 Concert correlating network SLO breaches with application signals
A network SLO breach in isolation is an engineering signal. A network SLO breach correlated with application error rate increases, business transaction failures and user experience degradation is a business incident. IBM Concert’s signal correlation capability [6] provides this correlation automatically: by ingesting both network‑level metrics and application‑level signals and correlating them against the shared topology graph it maintains, Concert can identify that a network path degradation and a simultaneous application response‑time spike are causally related — they affect the same services, in the same topological path, at the same time. This causal attribution reduces the mean time to understanding in network incidents, which in complex multi‑cloud estates can otherwise consume hours of manual investigation.
Concert also uses historical correlation to inform priority scoring: a network path degradation on a path that, historically, has always led to application SLO breaches within 5 minutes will receive a higher priority score than one on a path whose applications have proven resilient to moderate network fluctuations. Over time, this learning effect makes Concert’s prioritisation progressively more accurate for the specific topology of the organisation’s estate.
8.6.4 Automated responses to SLO breaches
When a network SLO breach is detected and correlated, the response sequence should be automated to the degree that policy permits. The first tier of automated response involves traffic rerouting: where multiple paths exist between two sovereign zones, Concert can recommend — and, within the bounded autonomy envelope [6], initiate — rerouting traffic from a degraded path to a healthier alternative, provided that all candidate paths satisfy the jurisdiction predicate of the relevant SLO. The second tier involves circuit breaking: when a path is sufficiently degraded that continued attempts are more harmful than a controlled failure, Istio’s circuit breaker configuration [15] can be updated automatically to stop traffic flowing over the degraded path, surfacing a controlled error to calling services that allows them to apply fallback logic rather than accumulating timeout queues. The third tier involves capacity scaling: where degradation is attributable to bandwidth saturation rather than path failure, alerting Concert’s integration with IBM Turbonomic can trigger capacity recommendations — provisioning additional interconnect bandwidth, redistributing load across available egress points, or migrating specific workloads closer to the data they are accessing.
8.6.5 Escalation to human operators
Automated responses are not unlimited in scope. When the degraded path serves a critical business function, when the alternative paths available are themselves approaching their SLO limits, or when the remediation options involve changes that exceed the bounded autonomy envelope — for example, changes to physical network infrastructure, modifications to sovereign zone boundary definitions, or traffic rerouting that would alter data residency — the response must escalate to human operators. Concert’s escalation mechanism [6] generates a structured incident notification that includes the SLO breach details, the correlation evidence, the automated actions already taken and their effects, and the specific decision or action that requires human authorisation. This structured handoff is important: it ensures that the human operator receives the context they need to act quickly and correctly, rather than needing to reconstruct the situation from raw telemetry.
8.7 Network‑aware self‑healing and agentic responses
Once the network is observable and SLOs are defined, agentic operations can incorporate network signals into self‑healing and optimisation. Agents might detect that latency between two zones is rising and recommend failing over to a local replica or degrading functionality to reduce cross‑zone calls; propose adjustments to service configurations — timeouts, retry policies, circuit breakers — to better handle current network conditions; or suggest workload relocation when sustained network issues make current placements untenable, consistent with sovereignty constraints and data gravity [1].
For event‑driven systems, agents can also act on event‑level network symptoms: if certain event channels exhibit high delivery latency or increased redelivery rates, agents may propose reconfiguring brokers, rerouting traffic or adjusting batching strategies [5][21]. Critically, in sovereign contexts, agents must respect connectivity policies. A naive optimisation — rerouting traffic through a faster but non‑compliant region — would be unacceptable. Network‑aware agents must therefore work in conjunction with policy engines and governance frameworks that encode which paths are permitted [2], and the bounded autonomy envelope for network remediation must be defined with explicit jurisdiction constraints that cannot be overridden even by high‑confidence agent recommendations.
Network‑aware self‑healing is therefore a combination of good observability, clear policies and SLOs, thoughtful automation and governance that constrains what agents may do — precisely the four‑planes decomposition introduced in Chapter 4.
8.8 Network observability as part of the evidence trail
Just as application and agent telemetry form part of the evidentiary fabric for sovereign operations, so too does network observability. When regulators and auditors ask how you ensure resilience and sovereignty, they are increasingly interested in actual behaviour, not just design diagrams. Network telemetry can show that critical services remained within latency budgets during a disruption, or how quickly they recovered; that failover events kept traffic within permitted regions rather than spilling into non‑compliant zones; and that particular cross‑zone or cross‑cloud links behaved as expected during tests or incidents [3].
Combined with application traces and logs, network observability enables the reconstruction of incidents in enough detail to show both engineering and compliance perspectives: what went wrong, why, how it affected users and obligations, and how it was addressed. To play this role, network data must be retained, secured and governed alongside other observability data. Flow logs, traces, metrics and topology snapshots become part of the audit record. They should be stored and accessed in line with sovereignty commitments, with appropriate retention periods and access controls [16].
8.9 Bringing it together
In zero‑copy, multi‑cloud, sovereign estates, the network is no longer a silent partner. It determines whether real‑time access is feasible, shapes where services and data can sensibly live, constrains which topologies are compliant, and influences how quickly and safely agents can act.
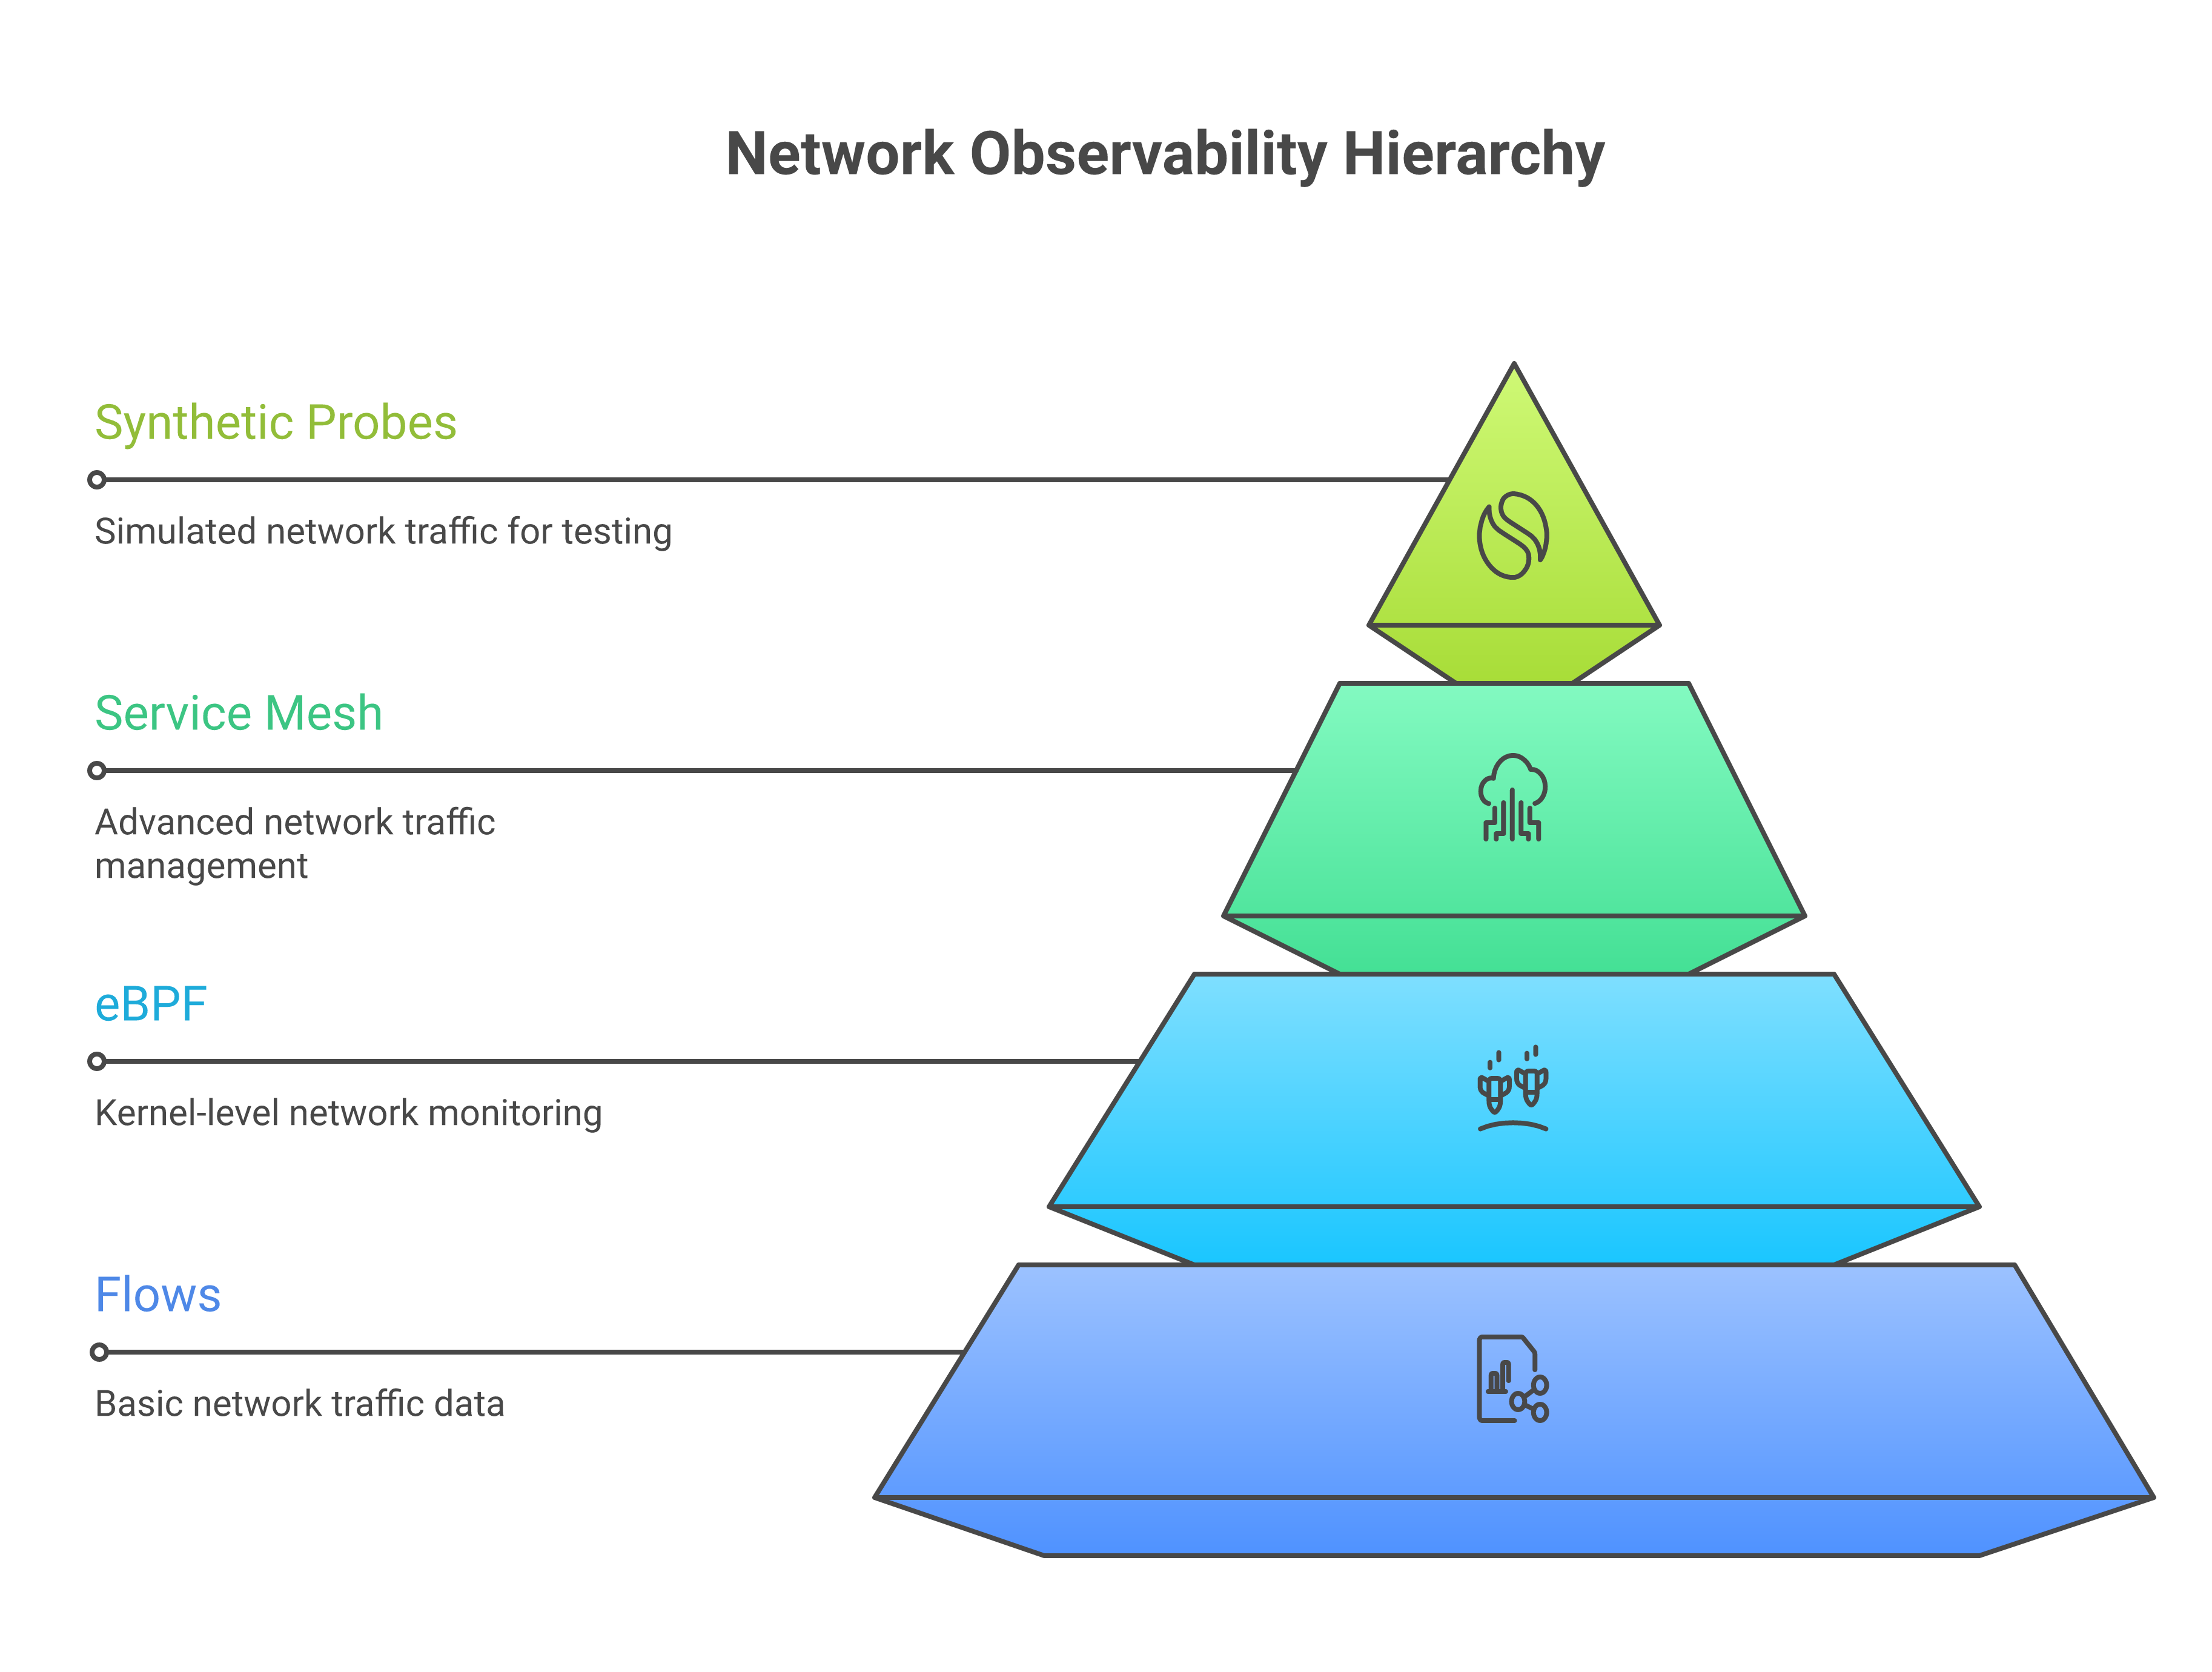
Network observability and performance management, therefore, are not specialised concerns for a separate team; they are integral parts of the sovereign operations architecture. They connect back to earlier chapters: to the topology and sovereign zone concepts of Chapter 5, to the zero‑copy substrate of Chapter 6, and to the observability plane of Chapter 7. The instrumentation layers introduced in this chapter — flows, eBPF, service mesh telemetry and synthetic probes — together provide the multi‑layer visibility that allows the network to be treated as an observable, governable component of the control plane rather than an opaque infrastructure element.
In later chapters, when we discuss autonomous and self‑healing patterns, agentic incident management and blueprints, we will assume that the network is observable, governable and part of the control plane by design, not by exception.
8.10 Network observability as sovereign evidence
8.10.1 Flow records as evidence of data residency compliance
The primary evidentiary function of network observability in a sovereign context is providing demonstrable proof that data flows have respected jurisdictional boundaries. IPFIX flow records [9] are particularly well suited to this role: each record carries source and destination addresses, timestamps, byte and packet counts, and — when enriched with network topology metadata — the geographic and administrative domains traversed by the traffic. When these records are collected continuously, retained under governance controls and made queryable, they form a time‑series record of every network conversation in the estate, from which compliance assertions can be derived.
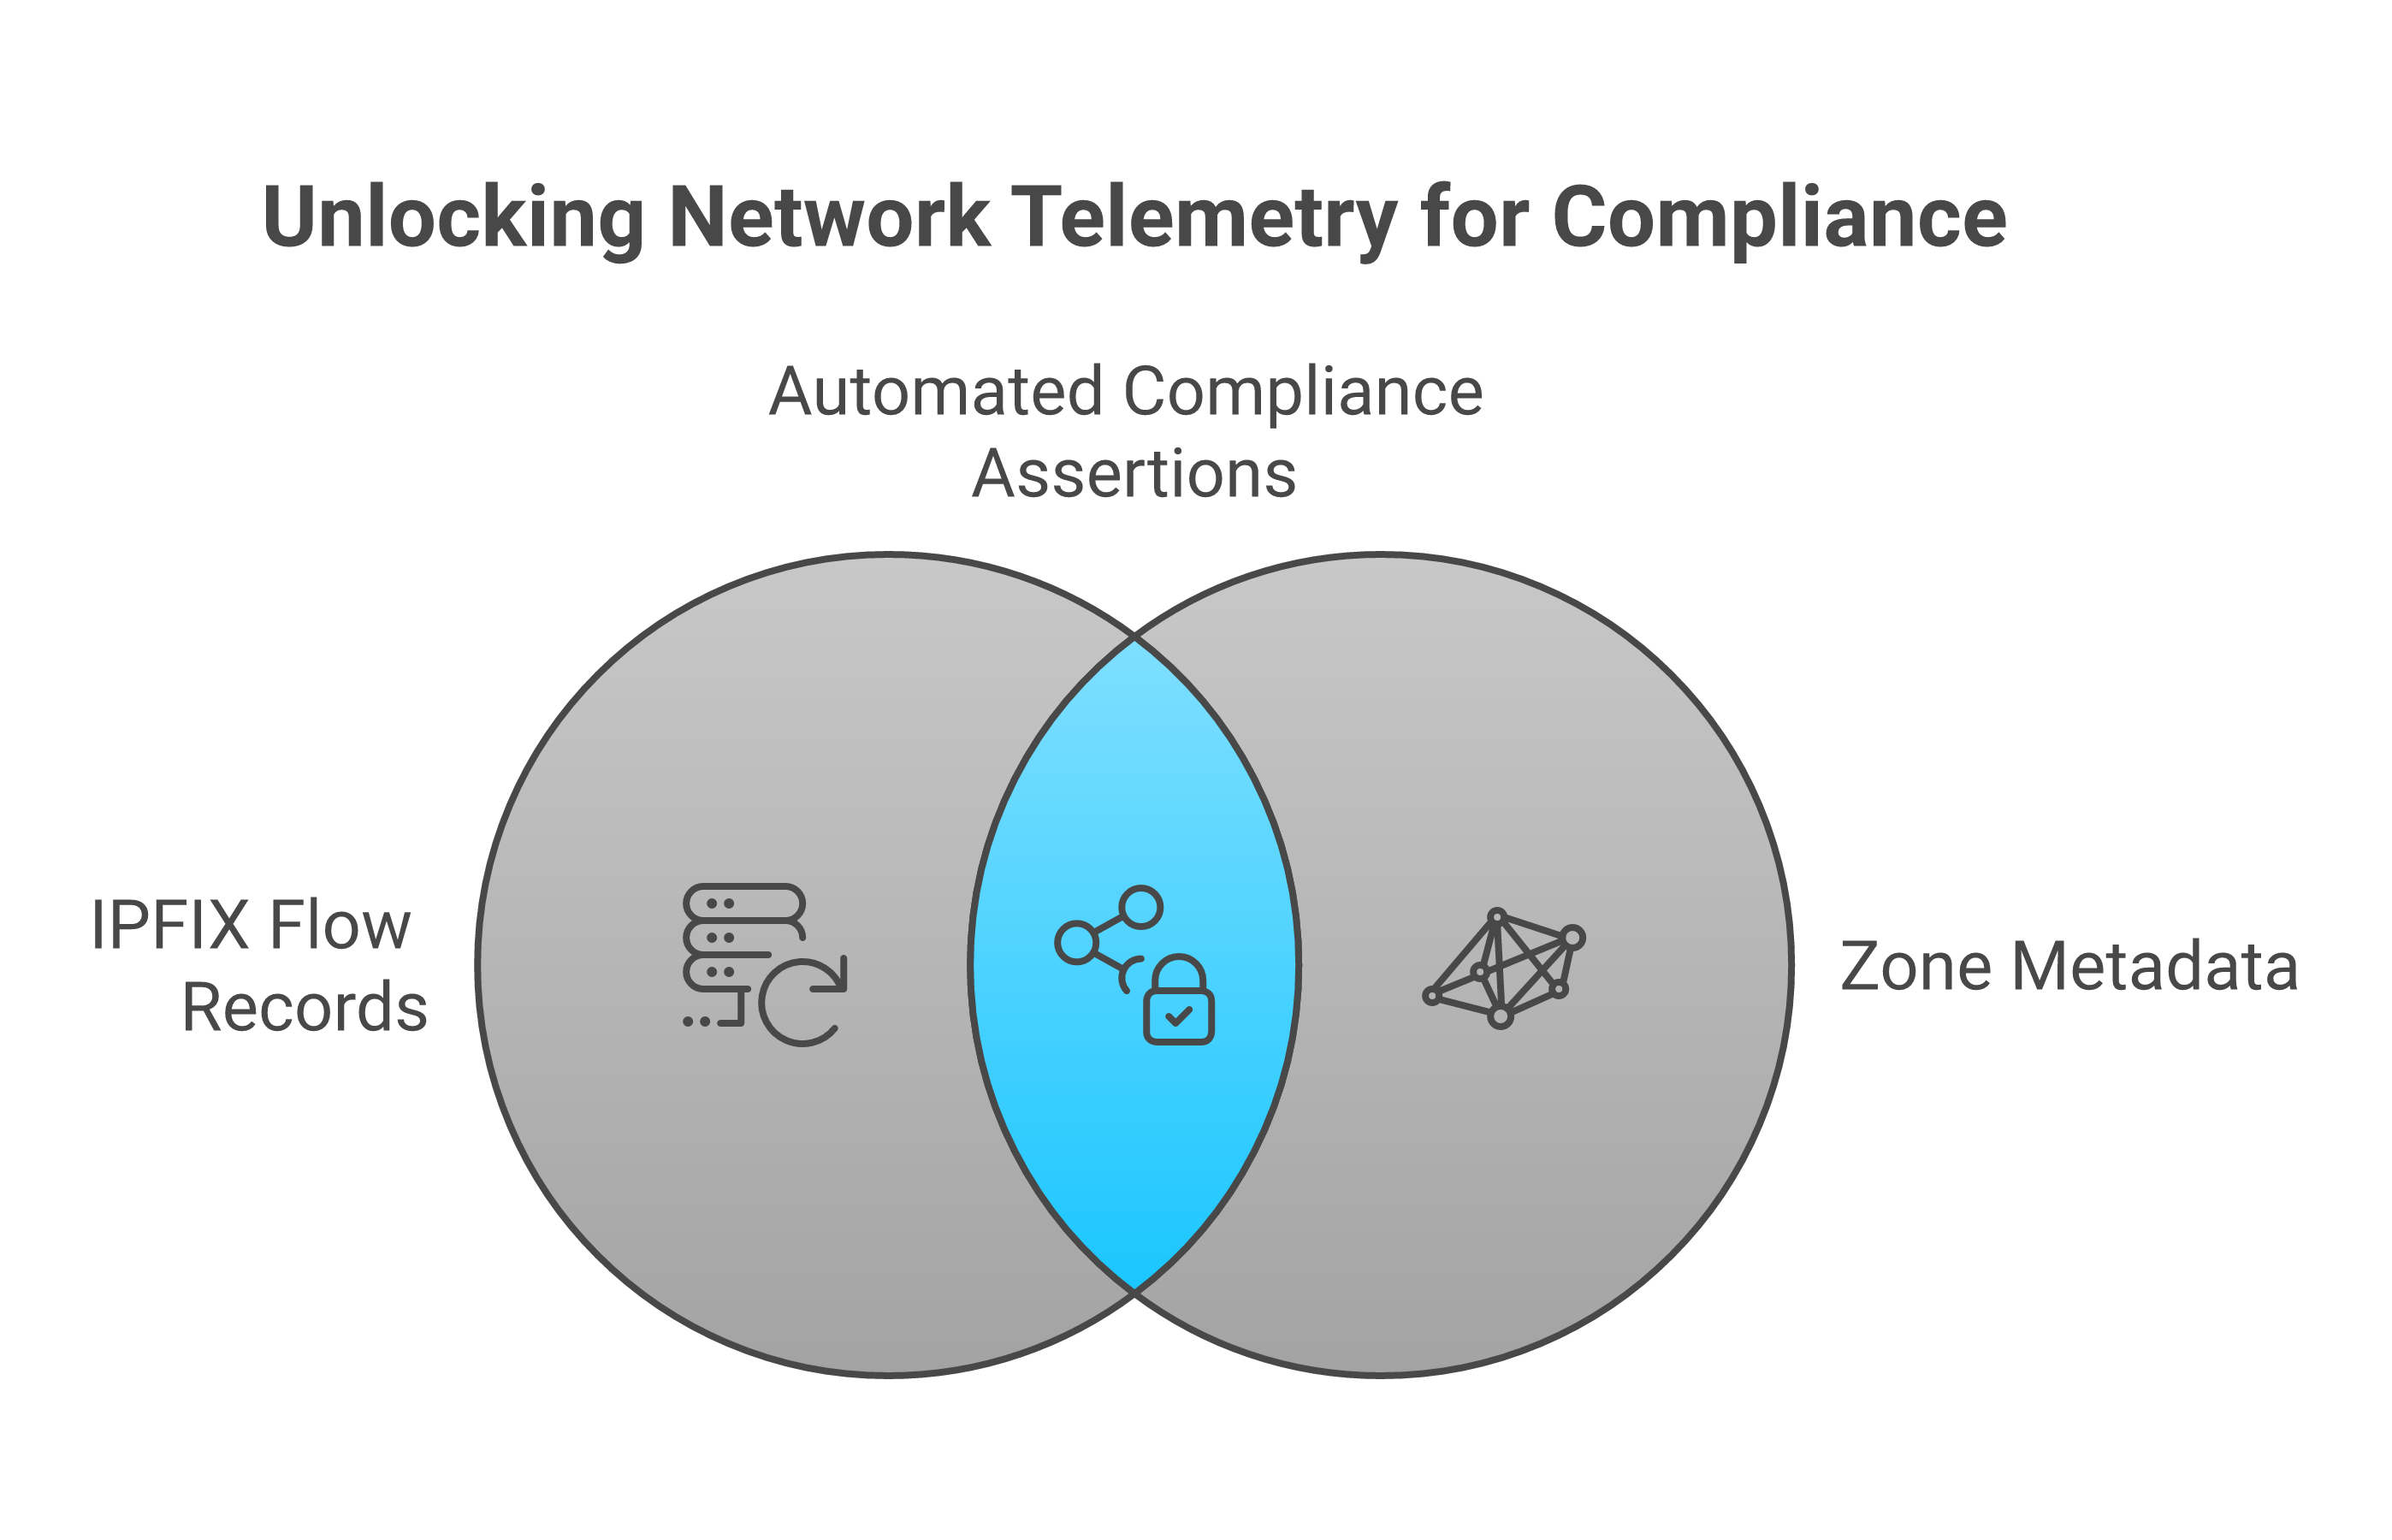
The key architectural requirement is that flow record collection must be comprehensive and tamper‑evident. A flow record corpus with gaps — periods during which collection was interrupted, devices from which export was not configured, or intra‑node traffic not captured — cannot provide the strong assurance that regulators seek. This is why the layered instrumentation approach described in section 8.3 matters: IPFIX captures inter‑node flows at the network infrastructure level; Cilium Hubble [14] captures intra‑node and intra‑cluster flows that never reach the physical network; Istio’s service mesh [15] captures application‑layer communication patterns. Together, these layers close the coverage gaps that would leave a flow record corpus incomplete.
8.10.2 Integrating network telemetry into the Governance and Audit Plane
Network telemetry on its own is raw data. Its evidentiary value depends on being integrated into the Governance and Audit Plane — the architectural layer, described in Chapter 4, that aggregates compliance‑relevant signals, applies policy assertions, and produces the structured evidence that auditors and regulators can interrogate. In practice, this integration requires network flow data and service mesh telemetry to be correlated with the topology graph maintained by Concert [6], so that raw IP flows can be annotated with the sovereign zone labels, data classification tags and regulatory obligation markers that make them interpretable as compliance evidence rather than mere network statistics.
IBM Instana [7] contributes to this integration by providing the network‑aware topology layer, with secure connectivity options such as AWS PrivateLink ensuring that telemetry itself travels over compliant paths [24]: it discovers which services are communicating over which paths and can annotate that discovery with sovereign zone metadata drawn from the organisation’s tagging taxonomy. This enriched topology, combined with flow‑level records, allows the Governance and Audit Plane to assert automatically that, for example, no service tagged as processing EU personal data established a network connection to an endpoint outside EU sovereign zones during a specified reporting period — an assertion that would previously have required manual analysis of firewall logs and network diagrams.
8.10.3 Retention requirements under DORA and NIS2
The Digital Operational Resilience Act [18] and the NIS2 Directive [19] both impose retention obligations on operational records that include network telemetry. DORA Article 17 requires financial entities to maintain detailed incident management records, including the chronological sequence of events during an incident and the technical evidence supporting incident classification. Network flow records and performance metrics are a core part of this chronological record: they show when degradation began, how it progressed, which services were affected and in what order, and whether recovery kept traffic within permitted boundaries. DORA’s implementing technical standards, developed by the European Supervisory Authorities, are expected to specify retention periods for ICT incident records of at least five years for significant incidents, a period that must be reflected in the organisation’s network telemetry retention architecture.
NIS2 Article 21 [19] requires essential and important entities to implement measures for monitoring, detecting and reporting cyber incidents, and to retain relevant records for supervisory review. Network telemetry — particularly flow records that can demonstrate whether an incident involved unauthorised lateral movement or data exfiltration across zone boundaries — is directly relevant to this obligation. The organisation’s retention architecture must ensure that network telemetry is stored in a form that is accessible for regulatory review but protected against unauthorised access, with zone‑local storage for raw records and aggregate or summary exports available to central compliance functions.
8.10.4 Automated compliance assertions from Instana and Cilium telemetry
The practical challenge of turning network telemetry into compliance evidence at scale is that manual inspection of flow records is infeasible in a dynamic, multi‑cloud estate generating millions of flow records per day. The solution is automated compliance assertion generation: the Governance and Audit Plane continuously evaluates incoming telemetry against a set of machine‑readable compliance rules and generates structured assertion records — statements of the form “During period T, no flow records indicate traffic crossing prohibited zone boundaries for data class D” — that can be presented to auditors without requiring them to inspect raw data.
IBM Instana’s network topology discovery [7] provides the semantic enrichment necessary to make flow records policy‑evaluable: by mapping IP addresses to services, services to sovereign zones, and zones to applicable regulatory regimes, Instana allows the policy engine to evaluate compliance predicates against enriched flow data rather than raw network addresses. Cilium Hubble’s [14] L7 flow records extend this to the application protocol level: compliance assertions can be made not only about which endpoints communicated but about which specific API calls or message types were exchanged, providing a finer‑grained evidential foundation for claims about data access and residency [23]. Together, these tools provide the automated evidence generation capability that transforms network observability from an engineering diagnostic tool into a first‑class component of the organisation’s sovereign compliance posture.
Key Takeaways
-
Network SLOs should be defined in terms of statistically meaningful percentile latency targets (p50, p95, p99), packet loss rates, jitter, bandwidth utilisation and error rates, and must carry a jurisdiction predicate asserting that measurements are only valid on compliant paths; error budgets, as advocated by Beyer et al. [4], make the cost of unreliability concrete and discipline the trade‑off between topology changes and stability.
-
The instrumentation stack for a sovereign network must be layered: IPFIX and NetFlow v9 [8, 9] provide comprehensive flow metadata at the network infrastructure level; eBPF‑based observability via Cilium Hubble [14] captures intra‑node and L7 flows invisible to traditional flow export; Istio service mesh telemetry [15] provides per‑service‑pair L7 metrics and distributed traces; and synthetic probing continuously verifies connectivity and latency on critical inter‑zone paths.
-
Packet capture in regulated environments must be time‑bounded, operator‑authorised and technically constrained to header‑only modes wherever possible, with capture sessions logged in the Governance and Audit Plane, in order to satisfy data minimisation obligations under GDPR Article 5(1)(c) [16] while preserving the diagnostic capability needed for serious network incidents.
-
Multi‑window, multi‑burn‑rate alerting [17] provides a principled approach to SLO breach detection that avoids both the noise of threshold‑based alerting and the lateness of single‑window budget exhaustion alerts, generating response urgency that is proportional to the actual rate of error budget consumption.
-
IBM Concert’s signal correlation capability [6] enables automatic causal attribution between network SLO breaches and application‑level impacts, reducing mean time to understanding in complex multi‑cloud network incidents and driving priority scoring that reflects real business exposure rather than raw metric severity.
-
Automated responses to SLO breaches — traffic rerouting, circuit breaking and capacity scaling — must operate within a bounded autonomy envelope [6] that encodes jurisdiction constraints explicitly, preventing naive optimisations from selecting faster but non‑compliant paths; escalation to human operators is mandatory for actions that exceed the autonomous envelope or that involve changes to sovereign zone boundary definitions.
-
IPFIX flow records [9], enriched with sovereign zone and data classification metadata from IBM Instana [7] and correlated with Cilium Hubble L7 data [14], form the primary evidentiary layer for demonstrating data residency compliance; retention of these records for the periods required by DORA [18] and NIS2 [19] must be built into the observability architecture from inception, not retrofitted as a compliance afterthought.
Bridge to Chapter 9 — Events, Lineage, and Operational Signals
This chapter has established the network as a first‑class risk, control surface and compliance evidence source in the sovereign zero‑copy enterprise. Beginning with the definition of network SLOs — grounded in statistical latency percentiles, error budgets and jurisdiction predicates — it has developed a layered instrumentation approach that combines IPFIX flow export, eBPF‑based observability through Cilium Hubble, Istio service mesh telemetry and synthetic probing to produce comprehensive, multi‑layer visibility across the estate. The treatment of SLO enforcement has extended from alert design, through Concert’s causal correlation capabilities, to the tiered automated response model and its escalation boundaries. The final sections have shown how network telemetry, enriched with topology and data classification metadata and retained under governance controls, becomes sovereign evidence: the technical foundation for demonstrating data residency compliance to auditors and regulators under DORA and NIS2.
Chapter 9 builds on this foundation by examining events, lineage and operational signals — the higher‑level information flows that give network observations their business meaning. Where this chapter has focused on the paths over which data travels, Chapter 9 is concerned with what travels over those paths and how the provenance, transformation and consumption of that information is recorded, traced and exposed to the operations cockpit. The lineage records described in Chapter 9 will depend on the network observability infrastructure established here: understanding that an event traversed a particular path, at a particular time, with a particular latency, is inseparable from understanding the business significance of that event in the sovereign operations context.
References
[1] J. Loughran, “Data Gravity in Cloud Storage: Why Location Matters for Performance,” Serverspace Technical Blog, Serverspace, 2024. [Online]. Available: https://serverspace.io/support/help/data-gravity-in-cloud-storage/
[2] Cognixia, “What Is Zero‑Copy Integration for Enterprise APIs?” Cognixia Blog, 2024. [Online]. Available: https://www.cognixia.com/blog/what-is-zero-copy-integration-for-enterprise-apis/
[3] K. Dempsey, N. Chawla, A. Johnson, R. Johnston, A. Jones, A. Orebaugh, M. Scholl, and K. Stine, “Information Security Continuous Monitoring (ISCM) for Federal Information Systems and Organizations,” NIST Special Publication 800-137, National Institute of Standards and Technology, Gaithersburg, MD, USA, Sep. 2011. [Online]. Available: https://doi.org/10.6028/NIST.SP.800-137
[4] B. Beyer, C. Jones, J. Petoff, and N. R. Murphy, Eds., Site Reliability Engineering: How Google Runs Production Systems. Sebastopol, CA, USA: O’Reilly Media, 2016. [Ch. 4: Service Level Objectives; Ch. 5: Eliminating Toil.] [Online]. Available: https://sre.google/sre-book/table-of-contents/
[5] Kurrent, “Benefits of Event Sourcing,” Kurrent Blog, Kurrent, Inc., 2024. [Online]. Available: https://www.kurrent.io/blog/benefits-of-event-sourcing/
[6] IBM Corporation, “IBM Concert — Product Documentation and Architecture Overview,” IBM, Armonk, NY, USA, 2025. [Online]. Available: https://www.ibm.com/docs/en/concert
[7] IBM Corporation, “Getting Started with IBM Instana Observability,” IBM Documentation, Armonk, NY, USA, 2024. [Online]. Available: https://www.ibm.com/docs/en/instana-observability/1.0.309?topic=references-getting-started-instana
[8] B. Claise, Ed., “Cisco Systems NetFlow Services Export Version 9,” IETF RFC 3954, Internet Engineering Task Force, Oct. 2004. [Online]. Available: https://www.rfc-editor.org/rfc/rfc3954
[9] B. Claise, Ed., B. Trammell, Ed., and P. Aitken, “Specification of the IP Flow Information Export (IPFIX) Protocol for the Exchange of Flow Information,” IETF RFC 7011, Internet Engineering Task Force, Sep. 2013. [Online]. Available: https://www.rfc-editor.org/rfc/rfc7011
[10] B. Claise, Ed., and B. Trammell, Ed., “Information Model for IP Flow Information Export (IPFIX),” IETF RFC 7012, Internet Engineering Task Force, Sep. 2013. [Online]. Available: https://www.rfc-editor.org/rfc/rfc7012
[11] sFlow.org, “sFlow Version 5 Specification,” sFlow Consortium, 2004. [Online]. Available: https://sflow.org/sflow_version_5.txt
[12] Linux Foundation, “eBPF — Extended Berkeley Packet Filter: Documentation and Reference,” eBPF Project, 2024. [Online]. Available: https://ebpf.io/
[13] B. Gregg, BPF Performance Tools: Linux System and Application Observability. Boston, MA, USA: Addison‑Wesley, 2019.
[14] Cloud Native Computing Foundation, “Cilium — eBPF‑based Networking, Observability, and Security: Project Documentation,” CNCF Graduated Project, 2024. [Online]. Available: https://docs.cilium.io/
[15] Istio Project, “Istio Service Mesh Documentation,” Istio Authors, Cloud Native Computing Foundation, 2024. [Online]. Available: https://istio.io/latest/docs/
[16] European Parliament and Council of the European Union, “Regulation (EU) 2016/679 of the European Parliament and of the Council of 27 April 2016 on the protection of natural persons with regard to the processing of personal data (General Data Protection Regulation — GDPR),” Official Journal of the European Union, vol. L 119, pp. 1–88, Apr. 2016. [Art. 5(1)(c): Data minimisation principle.] [Online]. Available: https://eur-lex.europa.eu/legal-content/EN/TXT/?uri=CELEX:32016R0679
[17] S. Murphy, B. Beyer, D. K. Rensin, K. Kawahara, and S. Thorne, Eds., The Site Reliability Workbook: Practical Ways to Implement SRE. Sebastopol, CA, USA: O’Reilly Media, 2018. [Ch. 5: Alerting on SLOs — multi‑window, multi‑burn‑rate alerting methodology.] [Online]. Available: https://sre.google/workbook/table-of-contents/
[18] European Parliament and Council of the European Union, “Regulation (EU) 2022/2554 of the European Parliament and of the Council of 14 December 2022 on digital operational resilience for the financial sector (Digital Operational Resilience Act — DORA),” Official Journal of the European Union, vol. L 333, pp. 1–79, Dec. 2022. [Art. 17: ICT‑related incident management and record retention.] [Online]. Available: https://eur-lex.europa.eu/legal-content/EN/TXT/?uri=CELEX:32022R2554
[19] European Parliament and Council of the European Union, “Directive (EU) 2022/2555 of the European Parliament and of the Council of 14 December 2022 on measures for a high common level of cybersecurity across the Union (NIS2 Directive),” Official Journal of the European Union, vol. L 333, pp. 80–152, Dec. 2022. [Art. 21: Cybersecurity risk management measures and incident record retention.] [Online]. Available: https://eur-lex.europa.eu/legal-content/EN/TXT/?uri=CELEX:32022L2555
[20] Grant Thornton India, “Observability and APM Services with IBM Instana,” Grant Thornton, 2024. [Online]. Available: https://www.grantthornton.in/globalassets/1.-member-firms/india/assets/pdfs/observability_and_apm_services_with_ibm_instana.pdf
[21] Coralogix, “How to Monitor an Event‑Driven System Architecture,” Coralogix Blog, 2024. [Online]. Available: https://coralogix.com/blog/monitor-event-driven-system-architecture/
[22] New Relic, “Why Observability Matters for Event‑Driven Architecture,” New Relic Blog, New Relic, Inc., 2024. [Online]. Available: https://newrelic.com/blog/infrastructure-monitoring/why-observability-matters-for-event-driven-architecture
[23] Hoop.dev, “How to Keep AI Data Lineage and AI Regulatory Compliance Secure with Database Governance Observability,” Hoop.dev Blog, 2024. [Online]. Available: https://hoop.dev/blog/how-to-keep-ai-data-lineage-and-ai-regulatory-compliance-secure-with-database-governance-observability/
[24] Amazon Web Services and IBM Red Hat, “Reduce Network Costs and Secure Observability with IBM Instana and AWS PrivateLink,” AWS and IBM Blog, 2024. [Online]. Available: https://aws.amazon.com/blogs/ibm-redhat/reduce-network-costs-and-secure-observability-with-ibm-instana-and-aws-privatelink/
[25] Transportation Security Administration, “Security Directive Pipeline-2021-02 Series: Cybersecurity Mitigation Actions, Contingency Planning and Testing,” U.S. Department of Homeland Security, Washington, DC, 2023. [Online]. Available: https://www.tsa.gov/sd-and-ea
[26] European Union Aviation Safety Agency, “Implementing Regulation (EU) 2023/203 — Information Security (Part-IS),” EASA, Cologne, Germany, 2023. [Online]. Available: https://www.easa.europa.eu/en/document-library/easy-access-rules/easy-access-rules-information-security
[27] IBM Corporation, “IBM NS1 Connect: Intelligent DNS and Traffic Steering,” IBM Documentation, Armonk, NY, USA, 2024. [Online]. Available: https://www.ibm.com/products/ns1-connect
Sovereign Cloud Operations: AI-Driven Management of Sovereign Estates
© 2026 by Alan Hamilton
is licensed under CC BY-SA 4.0


