Chapter 11 — Observability, Lineage, and Audit in Zero-Copy Environments
Maintaining Visibility, Accountability, and Compliance Across a Distributed Integration Estate
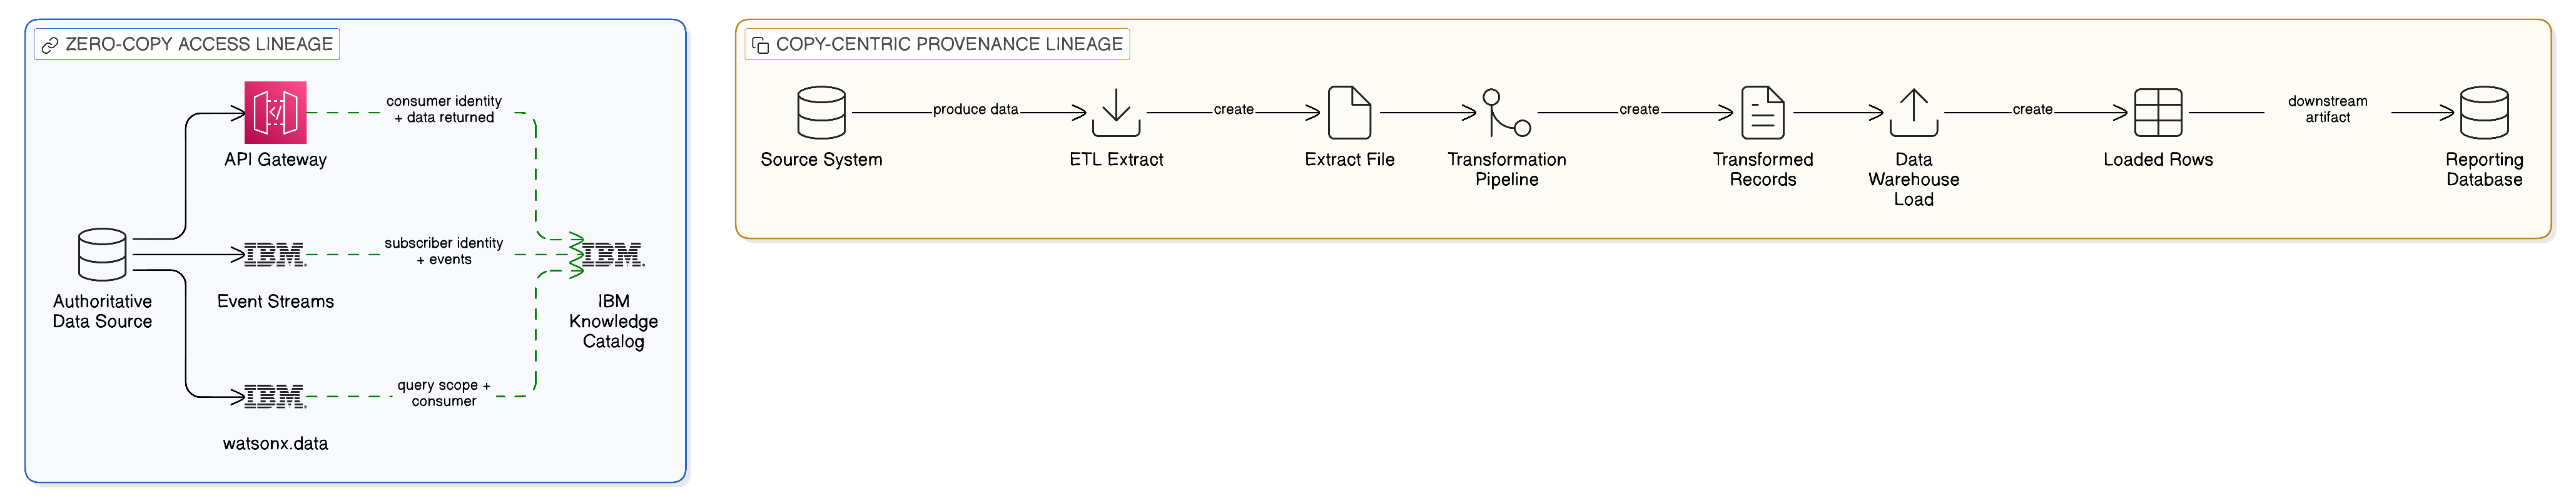
There is a paradox at the heart of Zero-Copy Integration that is easy to overlook in the enthusiasm for its technical elegance and commercial benefits. The architecture is designed to eliminate unnecessary data movement, and in doing so it eliminates many of the artefacts that conventional integration architectures rely upon for observability, governance, and compliance. In a copy-first architecture, data lineage is, in principle, traceable through the sequence of copies: a record that exists in a reporting database can be traced back to the operational system from which it was extracted, through the transformation pipeline that processed it, to the source record from which it originated. This lineage may be imperfectly recorded in practice, but the artefacts from which it could be reconstructed — the extract files, the transformation logs, the load histories — at least exist somewhere in the architecture. In a Zero-Copy architecture, where data is accessed in place and not replicated through transformation pipelines, these artefacts do not exist, and a naive approach to lineage and governance will leave the enterprise with less visibility over its integration estate than it had before.
This chapter argues that Zero-Copy Integration does not reduce the observability and governance of the integration estate; it transforms the nature of observability and governance, requiring new approaches that are suited to the distributed, access-based integration model rather than the movement-based model they replace. The transformation is from lineage of copies to lineage of access: instead of tracing a datum through the sequence of transformations that produced its current state, the enterprise traces the sequence of accesses through which different consumers have read and used it. Instead of monitoring the movement of data through pipelines, the enterprise monitors the requests that flow through its integration fabric — the API calls, the event subscriptions, the federated queries — and uses those requests as the primary observability artefacts of the integration estate.
The chapter is organised across five principal themes. It begins with the structural distinction between access lineage and provenance lineage and what that distinction demands of the governance toolchain. It then examines the three classes of lineage artefact — data access lineage, API call lineage, and event stream lineage — and the IBM and open-source mechanisms through which they are captured and unified. It gives extended attention to the operational observability dimension: the distributed tracing, AI-powered anomaly detection, and full-stack performance monitoring that IBM Instana, combined with the OpenTelemetry standard and its own proprietary agent technology, provides to the Zero-Copy enterprise. It addresses the audit and data-access governance contribution of IBM Guardium, the FinOps discipline applied to integration cost management, and concludes with a governance maturity model that provides the technology leader with a framework for planning and prioritising the investment in observability and governance capability.
11.1 Why Lineage Is More Complex Without Replication
In a conventional integration architecture, the data lineage problem is fundamentally a problem of provenance: given a datum in a downstream system, determine where it originated and how it was transformed before reaching its current location. This problem, whilst challenging in complex transformation pipelines, is bounded by the fact that each transformation step produces a new artefact — an extract file, a transformed record, a loaded row — that is in principle inspectable. The lineage graph is a directed acyclic graph of artefacts, and its reconstruction is a matter of recovering the edges between them.
In a Zero-Copy architecture, the lineage problem is different in character. Data is not copied from system to system; it is accessed in place, and its current state in the authoritative source is what every consumer reads. The lineage question is not “how did this datum reach this system?” but rather “which systems and users have read this datum, for what purpose, and under what access authorisation?” This is an access lineage question rather than a provenance question, and it requires different tooling to answer. It is also, in important respects, a harder question to answer: a copy creates a persistent artefact that is available for later inspection; an access creates a transient event that must be recorded in real time if it is to contribute to the lineage record.
The real-time recording of access events is therefore not merely an operational concern but a governance imperative in a Zero-Copy architecture. Every API call that returns data, every event delivered to a subscriber, every federated query executed against a data source must be recorded as an access event with sufficient metadata — the identity of the consumer, the data asset accessed, the access authorisation under which the access was permitted, and the business context of the access — to allow the lineage graph of data usage to be reconstructed from the access log. This is a volume and velocity challenge: in a large enterprise, the number of access events per day may be in the hundreds of millions, and recording each one with full lineage metadata at that volume requires an approach that is both technically efficient and operationally sustainable.
There is a further dimension to the lineage challenge in a Zero-Copy architecture that conventional copy-centric architectures do not face with the same intensity: the problem of cross-plane lineage stitching. In the Zero-Copy model, a single business transaction may traverse all three integration planes. A user action in a front-end application may invoke an API in the Application Integration Plane; that API invocation may trigger a message published to a topic in the Event Plane; the event consumer that receives the message may execute a federated query against a data source in the Data Plane. The complete lineage record of the business transaction is distributed across three planes, three sets of integration components, and potentially three governance systems. Without the ability to correlate the lineage record across all three planes — to stitch the API call, the event publication, and the data query into a single coherent lineage thread — the enterprise cannot demonstrate, in response to a regulatory enquiry or a data subject access request, the complete record of how a specific item of personal data was used in the course of a specific business transaction. Cross-plane lineage stitching is not a future aspiration; it is a compliance requirement in any regulatory context that demands end-to-end accountability for the use of personal or regulated data.
11.2 Event Lineage, Data Lineage, and API Lineage
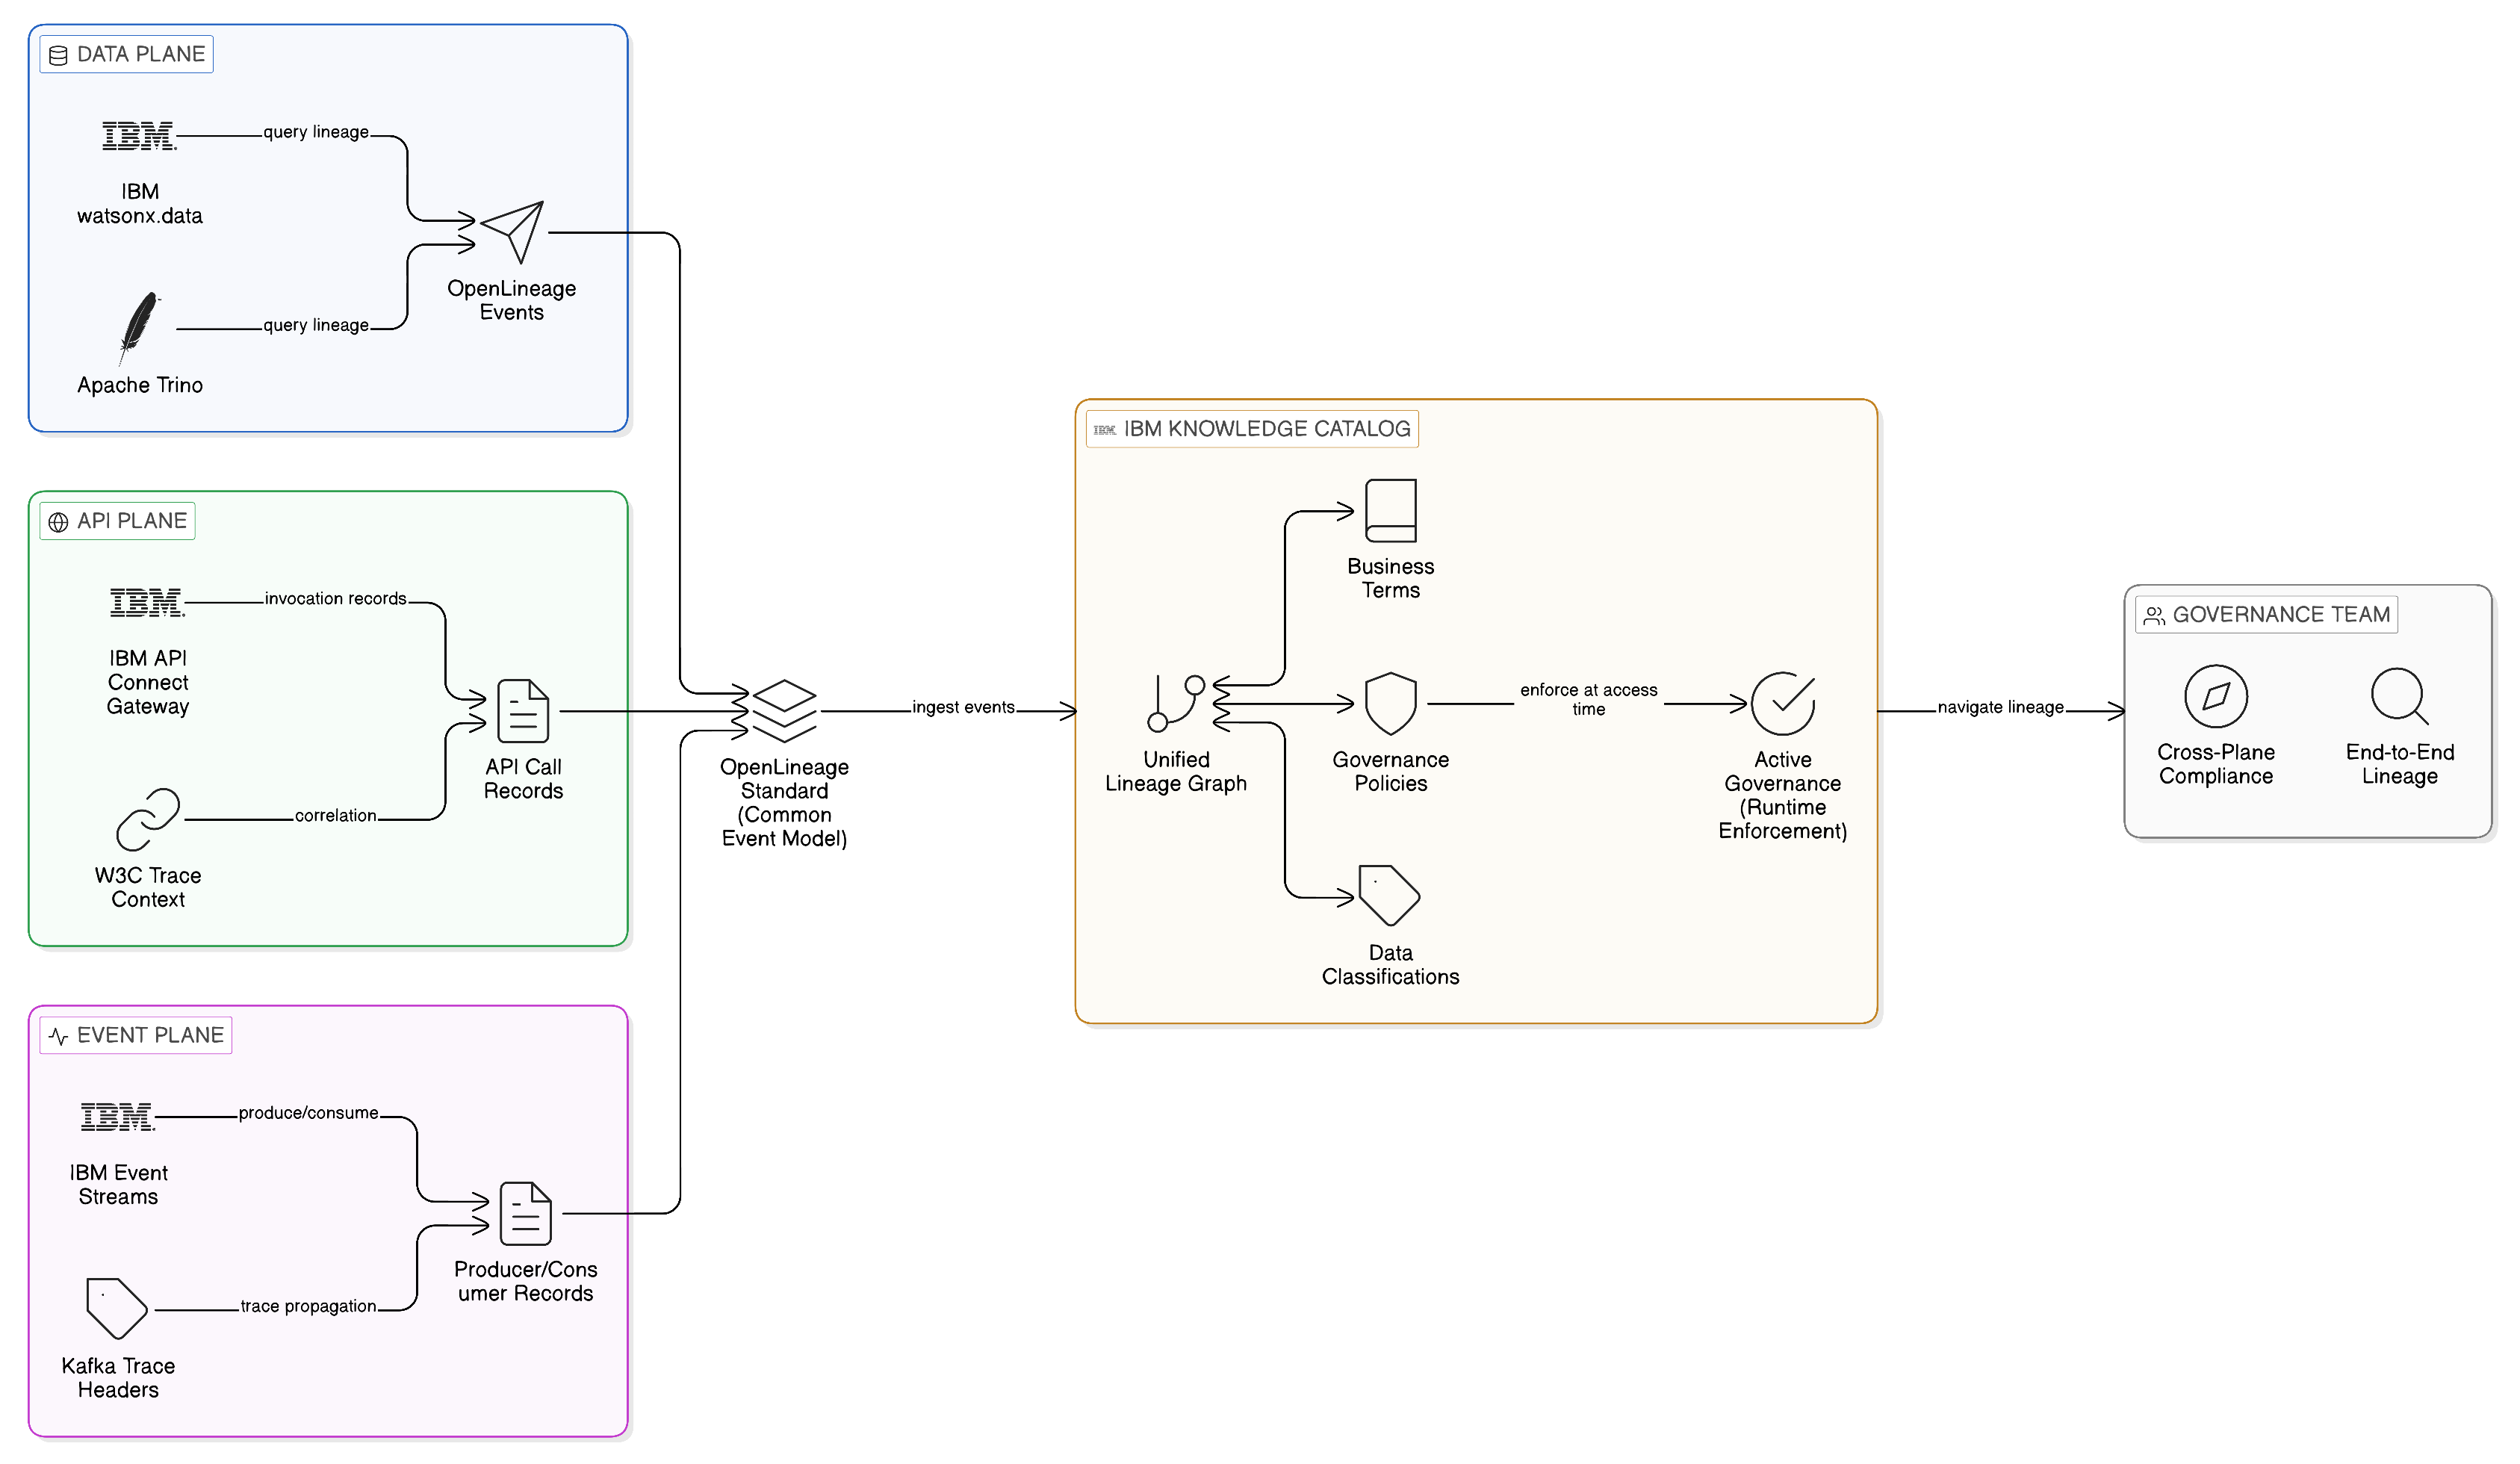
The integration fabric of a Zero-Copy architecture generates three distinct classes of lineage artefact, each corresponding to one of the three integration planes. Understanding the nature of each class is a prerequisite for designing an effective lineage capture and governance strategy.
Data lineage, in the Zero-Copy context, is the lineage of access to persistent data assets: the record of which consumers have queried which tables, views, or data products, what predicates and projections they applied, what data was returned, and under what governance authorisation the access was granted. Data lineage artefacts are generated by the query engines that execute federated queries — IBM watsonx.data, Apache Trino, and compatible engines — and by the data access governance layer that mediates between query engines and data sources. The OpenLineage project, an open standard for data lineage metadata maintained under the Linux Foundation’s LF AI and Data umbrella, defines a common event model for lineage metadata that is supported by a growing ecosystem of data platforms and governance tools, including Apache Spark, dbt, Apache Airflow, Great Expectations, and Trino. OpenLineage provides the lingua franca through which data lineage metadata from heterogeneous engines and platforms can be aggregated into a unified lineage graph, irrespective of the specific engine or platform that generated each artefact.
API lineage is the lineage of calls to integration APIs: the record of which API clients have invoked which API operations, with what request parameters, against which upstream systems, and with what response data. API lineage artefacts are generated by the API gateways that mediate access to integrated services — IBM API Connect, IBM DataPower Gateway, and comparable platforms — in the form of access logs and analytics events that record each API invocation with the metadata required to reconstruct its lineage context. The challenge of API lineage in a distributed topology is the correlation of API calls across multiple gateway instances: a single business transaction may invoke multiple APIs through multiple gateway instances in multiple regions, and the lineage record for that transaction must correlate the calls across gateway instances using a propagated transaction identifier — the trace context that the W3C Trace Context standard defines, and that OpenTelemetry propagates through distributed systems. Without this propagated context, the API lineage record consists of individual call records from each gateway that cannot be assembled into a coherent picture of the business transaction they collectively implement.
Event lineage is the lineage of events published to and consumed from the Event Plane: the record of which producers have published which events to which topics, which consumers have subscribed to those topics and received those events, and how events have been transformed as they flowed through the processing pipeline. Event lineage artefacts are generated by the event brokers — IBM Event Streams, Apache Kafka, and compatible platforms — in the form of producer and consumer metrics, offset records, and schema registry audit logs, supplemented by lineage metadata emitted by event processing applications instrumented to record their transformation logic. Kafka’s standard for event metadata headers provides a mechanism for propagating lineage context through the event stream: a producer that publishes an event enriches it with a trace context header; downstream processors that transform and re-publish the event carry that context forward; and downstream consumers that receive the final event can trace it back to its originating producer through the chain of transformations it has undergone. This context propagation is the event-plane expression of the same distributed tracing model that OpenTelemetry implements across all integration planes.
11.3 IBM Knowledge Catalog and the OpenLineage Standard
The three classes of lineage artefact described in the preceding section — data access events, API call records, and event stream metadata — are generated by different components of the integration fabric and exist in different formats and data stores. The governance value of lineage is proportional to the degree to which these artefacts can be integrated into a unified lineage graph that supports end-to-end traceability across the full integration estate. Without unification, the lineage record is a collection of disconnected point records; with unification, it becomes a navigable graph that allows governance teams to answer questions such as: “which business processes consume data from this source system?”, “which consumers were affected by the incorrect record published to this event topic?”, and “which API clients will be affected by the deprecation of this API operation?”
IBM Knowledge Catalog, a component of the IBM Cloud Pak for Data platform, provides the governance layer that integrates lineage artefacts from across the integration estate into a unified catalogue of data assets, lineage relationships, and governance policies. Knowledge Catalog ingests lineage metadata from data sources, query engines, ETL pipelines, and API management systems, and constructs a lineage graph that connects data assets to the business terms, policies, and classifications that govern their use. The catalogue’s lineage visualisation capability allows governance teams to navigate the lineage graph interactively, tracing the provenance of any catalogued data asset through the integration relationships that connect it to its sources, and identifying the downstream consumers that depend on it.
The integration of Knowledge Catalog with the OpenLineage standard is a significant capability for enterprises that operate heterogeneous integration estates. By consuming OpenLineage events from the tools that generate them — Trino, Apache Spark, dbt, Airflow, and others — Knowledge Catalog can construct lineage graphs that span the boundary between IBM and open-source components, providing a unified lineage record for an integration estate that uses both. This is particularly relevant in the context of federated analytics workloads, where a query orchestrated by an IBM watsonx.data instance may delegate computation to a Trino cluster that processes data in an open-source Apache Iceberg table: the lineage record for the query must span both the IBM component and the open-source component to provide complete end-to-end traceability. OpenLineage’s platform-neutral event model ensures that both components contribute their lineage artefacts in a common format that Knowledge Catalog can assemble into a single, coherent lineage thread.
11.3.1 Governance Policies in the Catalogue
The value of Knowledge Catalog extends beyond lineage recording to active governance policy enforcement. Catalogue-resident governance policies — data classifications, business term assignments, sensitivity ratings, retention schedules, and access restrictions — are used by the data access governance layer to evaluate access requests in real time: before a consumer’s federated query is executed against a data source, the governance layer consults the catalogue to determine whether the data source’s governing policy permits the query in the current context. This integration of the catalogue into the access path transforms the catalogue from a passive documentation system into an active governance mechanism that enforces policy at the point of access.
For the compliance team, this architecture provides a stronger assurance than a conventional governance model that relies on documentation, training, and periodic audits. The catalogue’s policies are enforced by the system, not relayed to operators who may or may not apply them correctly. Audit reports can be generated from the access log, demonstrating not merely that policies exist but that they have been applied to every access event. And the lineage graph constructed from the access log allows the compliance team to demonstrate, in response to a regulatory enquiry or a data subject access request, the complete record of how any specific data asset has been used within the integration estate.
11.4 IBM Instana, OpenTelemetry, and End-to-End Observability
Lineage governance, as described in the preceding sections, addresses the compliance and accountability dimension of observability: it answers questions about who accessed what, under what authority, and with what consequence. But the operational dimension of observability — answering questions about why the integration estate is performing as it is, where latency is accumulating, why a particular integration flow is failing, and whether the performance profile of a distributed transaction has changed in a way that warrants investigation — requires a different set of capabilities. These are the capabilities of distributed tracing, application performance monitoring, and AI-powered anomaly detection, and they are where IBM Instana, combined with the OpenTelemetry observability standard, delivers its most distinctive value to the Zero-Copy enterprise.
11.4.1 The Observability Challenge of Distributed Zero-Copy Architectures
The operational observability challenge of a Zero-Copy Integration architecture is more demanding than that of conventional monolithic or lightly distributed architectures, for reasons that flow directly from the architectural principles described in preceding chapters. A Zero-Copy integration flow is inherently distributed: it traverses multiple planes of the architecture, is executed by multiple runtime components across multiple sovereign zones, and generates performance characteristics that are shaped by the network topology, the query pushdown behaviour, and the load conditions of every component in the chain. When a consuming application reports slow responses, the cause may lie in any one of dozens of components along the integration path: the API gateway enforcing the access policy, the upstream service processing the API request, the event broker delivering the triggering event, the federated query engine executing the data access, or the network path connecting any of these components.
In a conventional monitoring architecture built on threshold-based alerting and separately managed monitoring tools for each integration component, diagnosing this kind of distributed performance problem is a time-consuming and expert-dependent activity. The operations team must manually correlate data from multiple monitoring systems, reconstruct the sequence of events along the integration path, and identify the component or network segment where performance degraded. This process is slow, error-prone, and dependent on the institutional knowledge of a small number of specialists who are familiar with each monitoring system and each component. It is also fundamentally reactive: the investigation begins only after the performance problem has become severe enough to trigger a threshold-based alert, by which point the business impact may already be significant.
IBM Instana addresses this challenge through a fundamentally different observability model: continuous, automated discovery of all components in the integration topology, automatic instrumentation of those components with telemetry agents, and AI-powered analysis of the resulting telemetry to identify performance anomalies and causal relationships without requiring manual threshold configuration or expert-driven correlation. The result is an observability capability that is both more comprehensive and more operationally efficient than conventional monitoring approaches — and one that is specifically designed for the distributed, dynamically changing topologies of modern cloud-native integration architectures.
11.4.2 IBM Instana: Architecture and Capabilities
IBM Instana is a full-stack observability platform designed for the automated discovery, monitoring, and performance analysis of distributed applications and infrastructure in dynamic cloud environments. Its architecture is built around three core capabilities that distinguish it from conventional monitoring platforms: autonomous discovery, automatic instrumentation through purpose-built agents, and AI-powered performance analysis and anomaly detection.
Autonomous discovery is Instana’s foundation. When an Instana host agent is deployed on a server, a virtual machine, or a Kubernetes node, it automatically discovers all processes running on that host and identifies the technologies they represent — whether Java applications, Node.js services, Go microservices, Apache Kafka brokers, IBM MQ queue managers, IBM App Connect Enterprise integration flows, PostgreSQL databases, or any of the hundreds of technologies that Instana’s technology catalogue encompasses. This discovery requires no manual configuration of monitoring targets, no maintenance of inventory lists, and no involvement from application development teams: Instana discovers what is running and begins collecting telemetry from it automatically. In a dynamic cloud environment where integration components are scaled up and down, redeployed, and migrated between infrastructure tiers as load demands and operational conditions change, this autonomous discovery is not merely a convenience — it is a practical necessity. A monitoring approach that requires manual registration of monitoring targets cannot keep pace with the rate of change of a cloud-native integration topology; gaps in monitoring coverage are inevitable, and those gaps are precisely where performance problems hide.
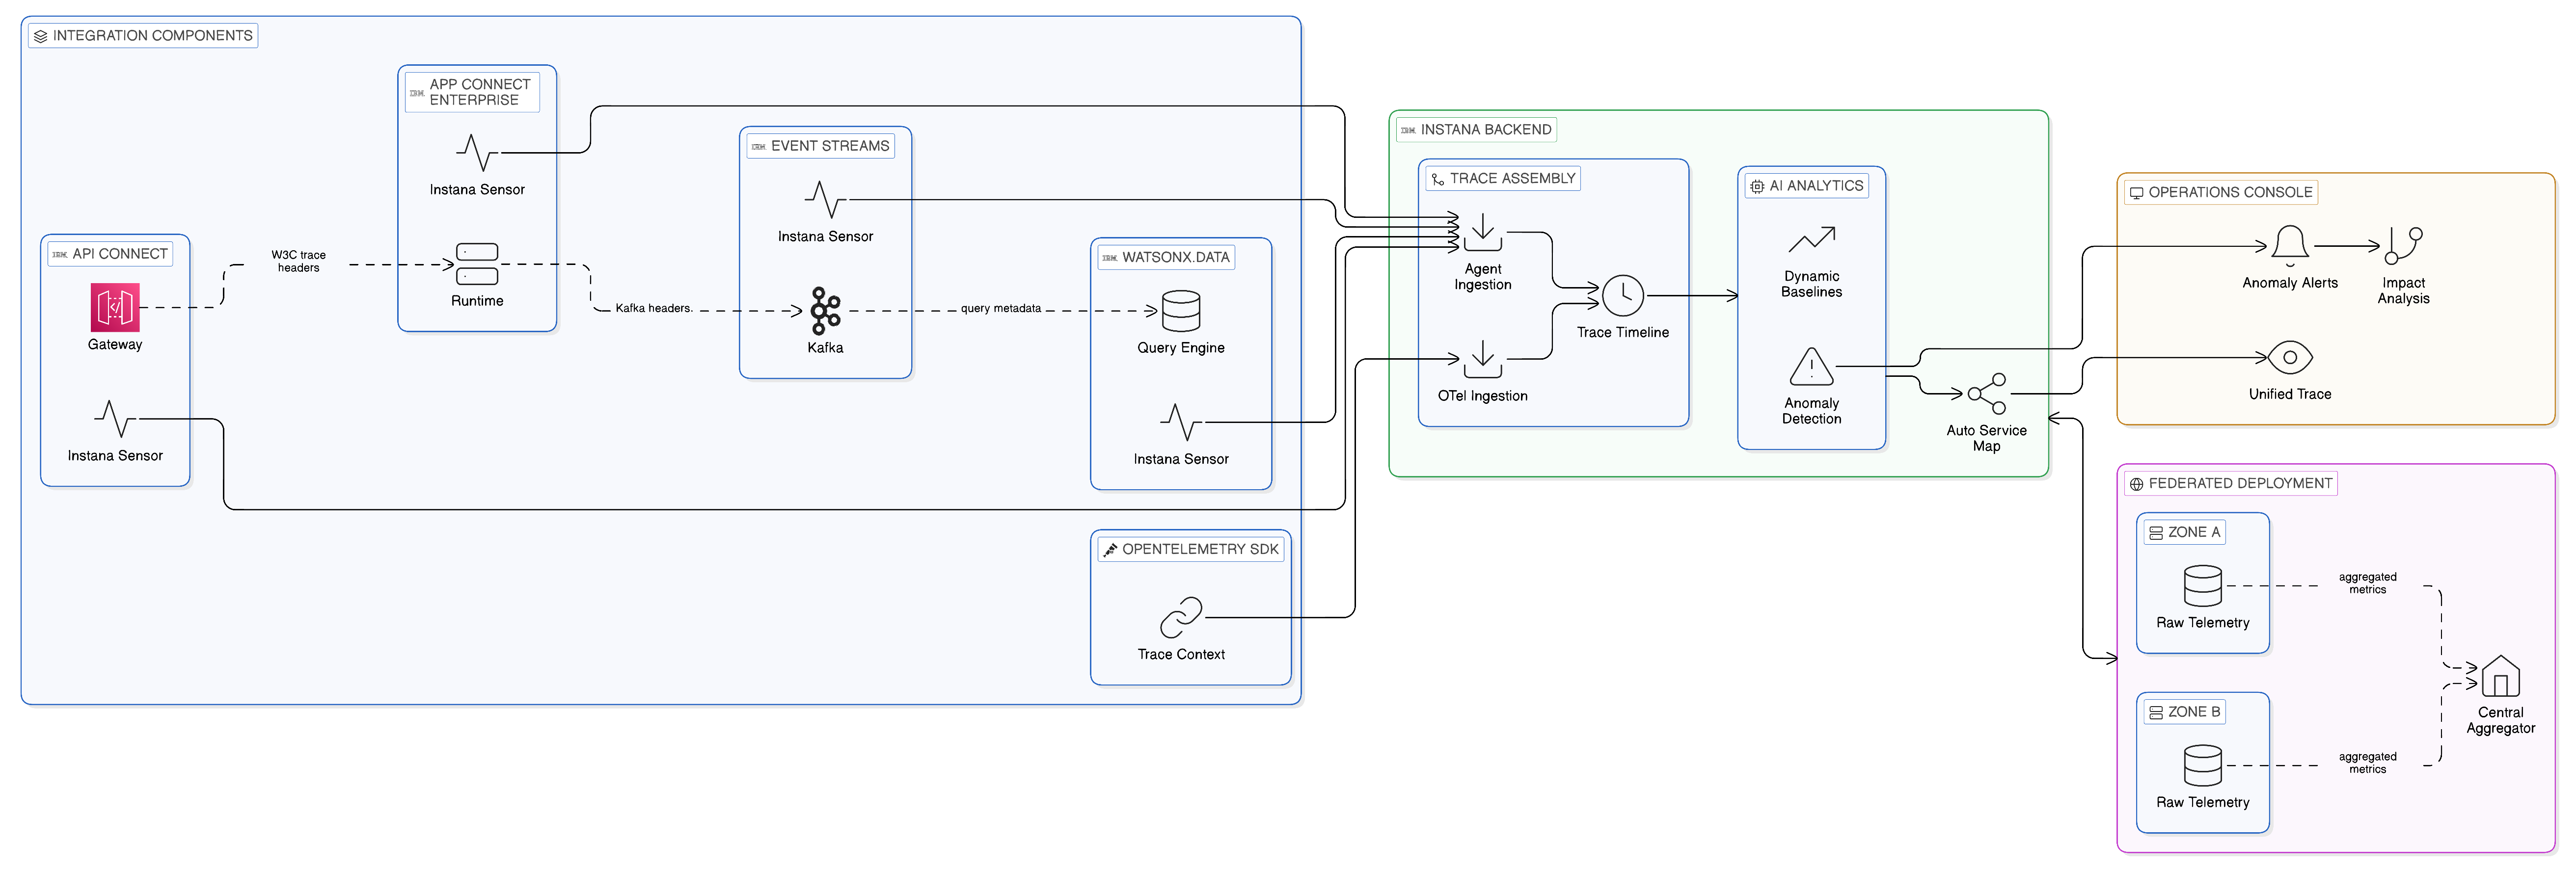
Automatic instrumentation is Instana’s second distinguishing capability. For each technology that Instana discovers, it deploys a purpose-built sensor — a lightweight, technology-specific instrumentation component — that collects telemetry at a level of detail that generic infrastructure monitoring cannot match. Instana’s IBM MQ sensor, for example, collects queue depth, message throughput, put and get rates, and consumer connection counts from IBM MQ queue managers, providing the operational visibility into the transactional messaging layer that conventional infrastructure monitoring — which sees only CPU and memory utilisation — cannot provide. Instana’s Kafka sensor collects topic-level producer throughput, consumer group lag, partition replication status, and broker health metrics from Apache Kafka and IBM Event Streams clusters, giving the operations team the event streaming observability that a distributed event-driven integration requires. Instana’s App Connect Enterprise sensor monitors integration flow execution rates, message processing latencies, and error rates within IBM App Connect Enterprise instances, making the internal performance of integration flows visible within the same operational console as the external performance of the services and consumers they connect.
The breadth of Instana’s technology catalogue is particularly significant in the context of a Zero-Copy Integration architecture, which spans multiple planes and multiple technologies. A single Instana deployment can monitor, within a unified operational view, every component of the integration estate: IBM API Connect gateways, IBM Event Streams brokers, IBM App Connect Enterprise integration servers, IBM MQ queue managers, IBM watsonx.data query engines, Red Hat OpenShift clusters, and the application services and databases that the integration fabric connects. This unified view is not achievable through a patchwork of separately managed monitoring tools, each providing visibility into one technology domain; it requires a platform that has invested in purpose-built instrumentation for each technology in the estate and that presents the telemetry from all of them within a single, coherent operational experience.
11.4.3 OpenTelemetry Integration and Distributed Tracing
The W3C Trace Context standard and the OpenTelemetry project provide the open instrumentation framework through which distributed systems propagate trace context across component and technology boundaries, enabling the correlation of telemetry from all components involved in a single end-to-end transaction. OpenTelemetry defines APIs, SDKs, and a data model for traces, metrics, and logs that are technology-neutral and supported by a broad ecosystem of observability platforms, including IBM Instana. By instrumenting integration components with the OpenTelemetry SDK — or by using OpenTelemetry-compatible instrumentation libraries that are built into modern frameworks and middleware — the enterprise can propagate a unique trace identifier through every component involved in an integration transaction, from the originating API call through the event publication, the event consumption, and the federated data query, to the response returned to the consuming application.
IBM Instana’s native support for OpenTelemetry means that it can receive, ingest, and correlate OpenTelemetry trace data from any instrumented component, regardless of the technology or vendor of that component. When an IBM App Connect Enterprise integration flow propagates an OpenTelemetry trace context in the headers of the message it processes, and the downstream IBM Event Streams consumer that receives that message forwards the same context to the IBM watsonx.data query it executes, Instana assembles the telemetry from all three components into a single distributed trace that shows the end-to-end timeline of the business transaction: how long the integration flow took to process the message, how long the event took to propagate through the broker to the consumer, how long the federated data query took to execute and return results. The root cause of a slow transaction is immediately visible in this trace timeline, without requiring manual correlation or expert knowledge of each component.
The relationship between OpenTelemetry and Instana’s own proprietary agent instrumentation is complementary rather than competitive. Instana’s agents provide deep, automatic instrumentation of technologies that OpenTelemetry SDKs cannot reach — legacy JVM applications that cannot be recompiled with new instrumentation libraries, IBM MQ and WebSphere Application Server processes whose internal telemetry is not exposed through open interfaces, and infrastructure-level metrics that are below the abstraction layer of application-level tracing. OpenTelemetry, in turn, provides the cross-platform trace propagation that allows Instana to correlate its deep proprietary telemetry with the trace context generated by components that Instana does not directly instrument: partner services, open-source components, and third-party cloud services that emit OpenTelemetry-compatible traces. Together, Instana’s agents and OpenTelemetry provide a complete observability coverage model: deep proprietary instrumentation where Instana has developed purpose-built sensors, and standards-based trace propagation and ingestion where the estate extends beyond Instana’s direct instrumentation reach.
For the Zero-Copy enterprise, this combined instrumentation model is the practical resolution of the cross-plane lineage stitching challenge described in Section 11.1. The OpenTelemetry trace context propagated through API calls, event headers, and data query metadata is the technical mechanism that allows the lineage thread of a business transaction to be assembled from the telemetry records of every component it traverses. The lineage graph in IBM Knowledge Catalog represents the governance view of data usage; the distributed trace in IBM Instana represents the operational view of transaction performance. Together, they provide the complete observability picture of the Zero-Copy integration estate: what data was accessed, by whom, under what authorisation, how the transaction performed, and where any deviation from expected behaviour occurred.
11.4.4 AI-Powered Anomaly Detection and Dynamic Baselining
IBM Instana’s AI-powered anomaly detection capability addresses the operational management challenge described in Chapter 9: the ratio of integration complexity to the human capacity to monitor and respond to it. A Zero-Copy integration estate of meaningful scale generates telemetry at a rate and volume that cannot be managed through manual threshold configuration and human review of dashboards. The number of metrics that must be monitored — response times, error rates, throughput, consumer lag, query execution times, network latency — multiplied by the number of components that generate them, produces a monitoring surface that exceeds the attention capacity of any operations team. Static thresholds are, in this context, both practically unmanageable — requiring a specialist to set and maintain a threshold for each metric of each component — and technically inadequate, because they cannot distinguish between a metric value that is anomalously high for a particular time of day and one that is normal for the same time on a day of high business volume.
Instana’s approach to this problem is dynamic baselining: for each metric of each component that it monitors, Instana constructs a statistical baseline model that captures the expected range of that metric under normal operating conditions, accounting for the time-of-day, day-of-week, and seasonal patterns that characterise the metric’s natural variability. Anomaly detection then operates against this dynamic baseline rather than against a static threshold: a metric value is flagged as anomalous when it deviates from the expected range for the current temporal context, not when it crosses a fixed absolute threshold. This approach dramatically reduces both false positives — where a metric value that is normal for a high-volume period triggers a threshold alert because it exceeds the threshold set for average conditions — and false negatives — where a metric value that is anomalous for a low-volume period does not trigger an alert because it is below the threshold set for peak conditions.
In the context of the Zero-Copy integration estate, this dynamic anomaly detection has particular operational value for the detection of gradual degradation patterns — the slow increase in event consumer lag that indicates a consumer falling behind the production rate, the progressive growth in federated query execution time that indicates an upstream data source approaching a capacity constraint, the incremental increase in API gateway error rates that indicates a downstream service beginning to struggle under load. These patterns are precisely those that static threshold alerting is least equipped to detect: they do not cross an absolute threshold in any single observation, but they represent a significant deviation from normal behaviour that, if identified early, can be remediated before the degradation crosses the threshold of operational impact. Instana’s dynamic baseline detects them as they emerge, giving the operations team time to investigate and act before the business is affected.
Instana’s automatic dependency mapping complements this anomaly detection capability. For every component it monitors, Instana automatically maps the dependencies that exist between that component and the components it communicates with, constructing a real-time service dependency graph that represents the current topology of the integration estate. This dependency graph is the foundation for Instana’s impact analysis capability: when an anomaly is detected in a component, Instana automatically identifies all downstream components that depend on the affected component and assesses the likely impact of the anomaly on each of them. For a Zero-Copy integration estate where the failure of an event broker or a federated query engine may have cascading effects across dozens of consuming applications, this automated impact analysis is an invaluable operational tool: it tells the operations team, immediately upon detection of an anomaly, how many applications are affected, what their business criticality is, and which of them requires immediate attention.
11.4.5 Instana in a Federated Observability Architecture
As established in Chapter 10, the distributed sovereignty-conscious topology of the Zero-Copy enterprise requires a federated observability architecture in which raw telemetry is retained within the sovereign zone that generated it, and only aggregated, anonymised operational metrics are exported to the central operations team. IBM Instana supports this federated model through its Instana backend deployment options, which allow an Instana backend instance to be deployed within each sovereign zone, collecting and retaining raw telemetry locally, whilst participating in a federated hierarchy that provides the central operations team with aggregated cross-zone health and performance data. Zone-level Instana instances communicate with the central instance through a summary data export that shares the operational metrics required for cross-zone health monitoring without exporting the raw transaction telemetry that may contain sovereignty-regulated data.
This federated Instana deployment model preserves all of the observability capabilities described in the preceding subsections within each zone: autonomous discovery, automatic agent-based instrumentation, OpenTelemetry ingestion, distributed tracing, and AI-powered anomaly detection all operate fully within the zone without dependence on the central instance. The central instance provides the cross-zone operational view: the enterprise-level health dashboard, the cross-zone distributed trace assembly for transactions that span multiple zones, and the enterprise-wide anomaly detection that identifies correlated anomalies across zones that may indicate a systemic issue rather than a zone-specific incident. This combination of local operational autonomy with enterprise-level visibility is the observability expression of the distributed execution, centralised governance model that is the architectural theme of this book.
11.5 IBM Guardium and Data Access Audit
The observability of the Zero-Copy integration estate has two distinct dimensions that must be considered separately, even though they are closely related and mutually reinforcing. The operational observability dimension — performance monitoring, anomaly detection, distributed tracing — is addressed by IBM Instana as described in the preceding section. The data access audit dimension — the question of which users and applications accessed which data, under what authorisation, and in compliance with which governance policies — is addressed by IBM Guardium, IBM’s data security and compliance monitoring platform.
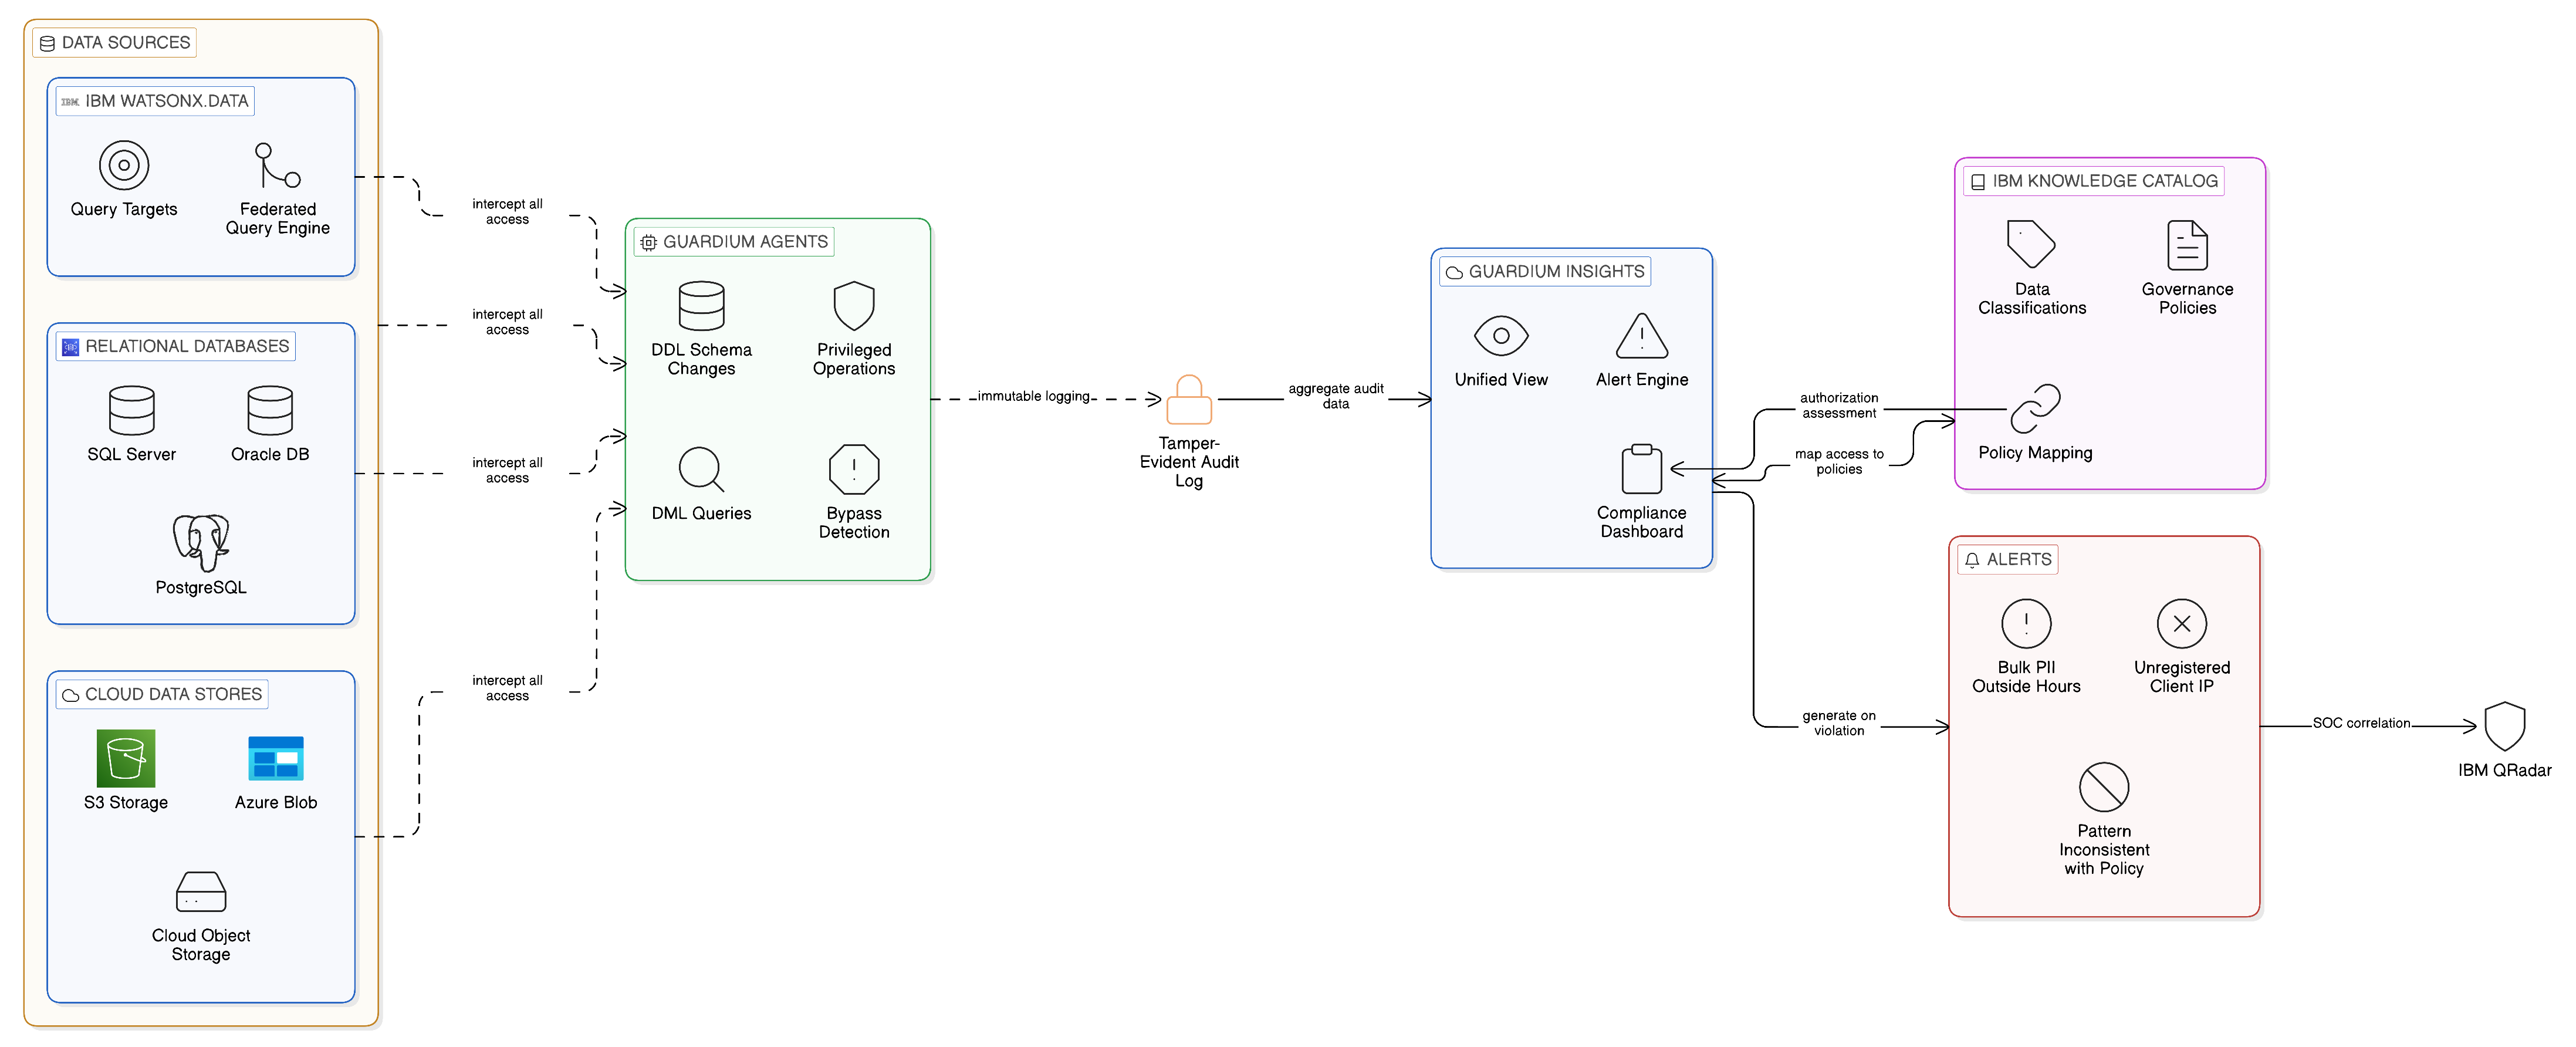
IBM Guardium provides the enterprise-grade data access monitoring capability that regulated industries require for compliance with frameworks including GDPR, HIPAA, PCI DSS, and the financial services regulations applicable in major jurisdictions. It monitors data access at the database and data store level, recording every query, every access event, and every privileged operation — including DDL statements that modify data structures, not only DML statements that read or modify data — in a tamper-evident audit log that is separate from the audit logs of the monitored systems themselves. This separation is significant: an audit log that resides within the system being audited can, in principle, be modified by a sufficiently privileged user of that system; an audit log maintained by an independent monitoring platform provides a stronger assurance of audit integrity.
In the context of a Zero-Copy Integration architecture, Guardium’s role is to provide the independent, tamper-evident audit of data access events at the data source level — complementing the access lineage captured in IBM Knowledge Catalog and the operational telemetry captured by IBM Instana. Where Knowledge Catalog records the governance authorisation under which a federated query was executed, and Instana records the performance characteristics of that query’s execution, Guardium records the query itself — the SQL statement, the parameters, the result set metadata — at the database level, capturing not only the queries that were submitted through the governed integration fabric but any query that reaches the data source by any path. This comprehensive capture, including queries submitted outside the governed fabric, is the specific capability that Guardium provides that neither Knowledge Catalog nor Instana can replicate: it is the backstop that detects access that bypasses the governance controls of the fabric, whether through misconfiguration, privilege escalation, or deliberate circumvention.
Guardium’s integration with IBM Knowledge Catalog enables the correlation of the two audit streams: Guardium’s database-level access records can be mapped to the Knowledge Catalog’s governance policies and data classifications, allowing the compliance team to assess whether each database access that Guardium recorded was authorised by a catalogued governance policy or whether it represents an ungoverned access that requires investigation. Guardium’s alert capability can be configured to generate immediate notifications when it detects access patterns that are inconsistent with the governance policy — for example, a query that retrieves a large number of rows of personal data outside normal business hours, or a database connection from a client IP address that is not associated with any registered integration asset in the Knowledge Catalog. These alerts are the early warning mechanism for compliance incidents that, left undetected, could become material regulatory violations.
11.6 FinOps for Integration: The Cost of Every Flow
Governance in the Zero-Copy Integration architecture is not limited to data governance and compliance. It also encompasses the economic governance of the integration estate: the management of the costs incurred by integration workloads, and the attribution of those costs to the business domains that own and consume integration assets. This economic governance discipline — commonly described as FinOps when applied to cloud workloads — is equally applicable to the integration estate in its hybrid cloud instantiation, and is a critical enabler of the Zero-Copy philosophy’s economic benefits.
The economic case for Zero-Copy Integration rests on the claim that accessing data in place is less expensive than replicating it: less expensive in egress charges, in storage costs, and in the compute required to process and maintain replicated copies. This claim is true in principle, but its realisation in any specific enterprise depends on the integration choices that domain teams actually make. If domain teams are not aware of the cost implications of their integration design decisions — if they choose to replicate data because replication is familiar and its costs are invisible to them — then the economic benefits of Zero-Copy Integration will not be realised. The FinOps discipline, applied to integration, makes those costs visible and attributable, creating the incentive structure that drives domain teams towards zero-copy patterns.
The practical implementation of FinOps for integration requires that the integration fabric measure and record the cost of every integration flow: the compute cost of each API request, the cost of each event delivered, the query compute and the network egress cost of each federated data access. These costs must be measured at the granularity of the individual integration asset — the specific API, the specific event topic, the specific data source — and attributed to the business domain that owns the asset and the business domain that consumes it. The fabric’s cost attribution model then aggregates these per-flow costs into domain-level summaries that can be incorporated into the chargeback or showback model that the enterprise uses for technology cost management.
11.6.1 Measuring Cost per Flow, per Query, per Event
The measurement of integration costs at the per-flow level requires instrumentation of each integration component with cost attribution metadata. For API flows, the cost measurement includes the compute cost of processing each request at the API gateway — measured in CPU-seconds or request units, depending on the gateway’s billing model — the network cost of transmitting the request and response over the applicable network path, and the cost of the upstream system interaction that the gateway performs on behalf of the API consumer. For event flows, the cost measurement includes the produce and consume compute costs at the broker, the storage cost of retaining the event for the configured retention period, and the network cost of delivering the event to each subscriber. For data access flows, the cost measurement includes the query compute cost at the federated query engine, the storage access cost at the data source, and the network egress cost of transmitting query results from the source to the consumer.
IBM Cloud Pak for Integration provides the usage metering and reporting capabilities that enable this per-flow cost measurement. API Connect records per-invocation usage metrics that can be exported to cost management tools; Event Streams records producer and consumer throughput metrics that enable per-topic cost allocation; and watsonx.data provides query cost attribution through its query execution engine. IBM Instana complements these platform-native metrics by providing the resource utilisation telemetry from the infrastructure on which integration components run, enabling the allocation of infrastructure costs to the specific integration workloads that consume them — a granularity of cost attribution that platform-native metrics alone cannot provide. These metrics, when combined with the cloud provider’s network egress billing data, provide a comprehensive cost model for the integration estate that FinOps practitioners can use to identify optimisation opportunities and to attribute costs to the domains that incur them.
For the CIO whose enterprise is evaluating the economic case for Zero-Copy Integration, the FinOps capability described here provides the evidence base. By comparing the per-flow costs of zero-copy access patterns against the equivalent costs of replication-based alternatives — accounting for the egress, storage, and processing costs of maintaining replicated copies — the enterprise can quantify the economic benefit of the architectural shift and use that quantification to justify the investment in integration fabric infrastructure and governance capability.
11.6.2 Capacity Planning and IBM Turbonomic
The FinOps discipline for integration encompasses not only the attribution of current costs but the management of future capacity and the optimisation of resource allocation across the integration estate. IBM Turbonomic, IBM’s application resource management platform, extends the FinOps capability of the Zero-Copy integration estate into the domain of automated capacity management and workload optimisation. Turbonomic analyses the performance and resource utilisation data collected from the integration estate — drawn in part from the IBM Instana telemetry described in the preceding section — and generates continuous, AI-driven recommendations for the resizing of integration workload resources, the rescheduling of batch integration processes, and the rebalancing of workloads across the available infrastructure to maintain performance targets whilst minimising resource waste.
In the context of a Zero-Copy integration estate, Turbonomic’s most significant contribution is the prevention of the over-provisioning that commonly afflicts integration infrastructure: teams that lack reliable performance baselines tend to provision conservatively, resulting in idle compute capacity that incurs cost without generating value. Turbonomic’s continuous right-sizing analysis, informed by Instana’s real-time and historical performance telemetry, provides the evidence base for confident right-sizing decisions that reduce infrastructure costs without compromising the performance service levels that the integration fabric must maintain. This cost optimisation, surfaced to FinOps practitioners and domain owners in actionable recommendations, reinforces the economic discipline of the Zero-Copy model and ensures that the cost benefits of the architecture are realised through ongoing operational management rather than eroded by infrastructure over-provisioning.
11.7 A Zero-Copy Governance Maturity Model
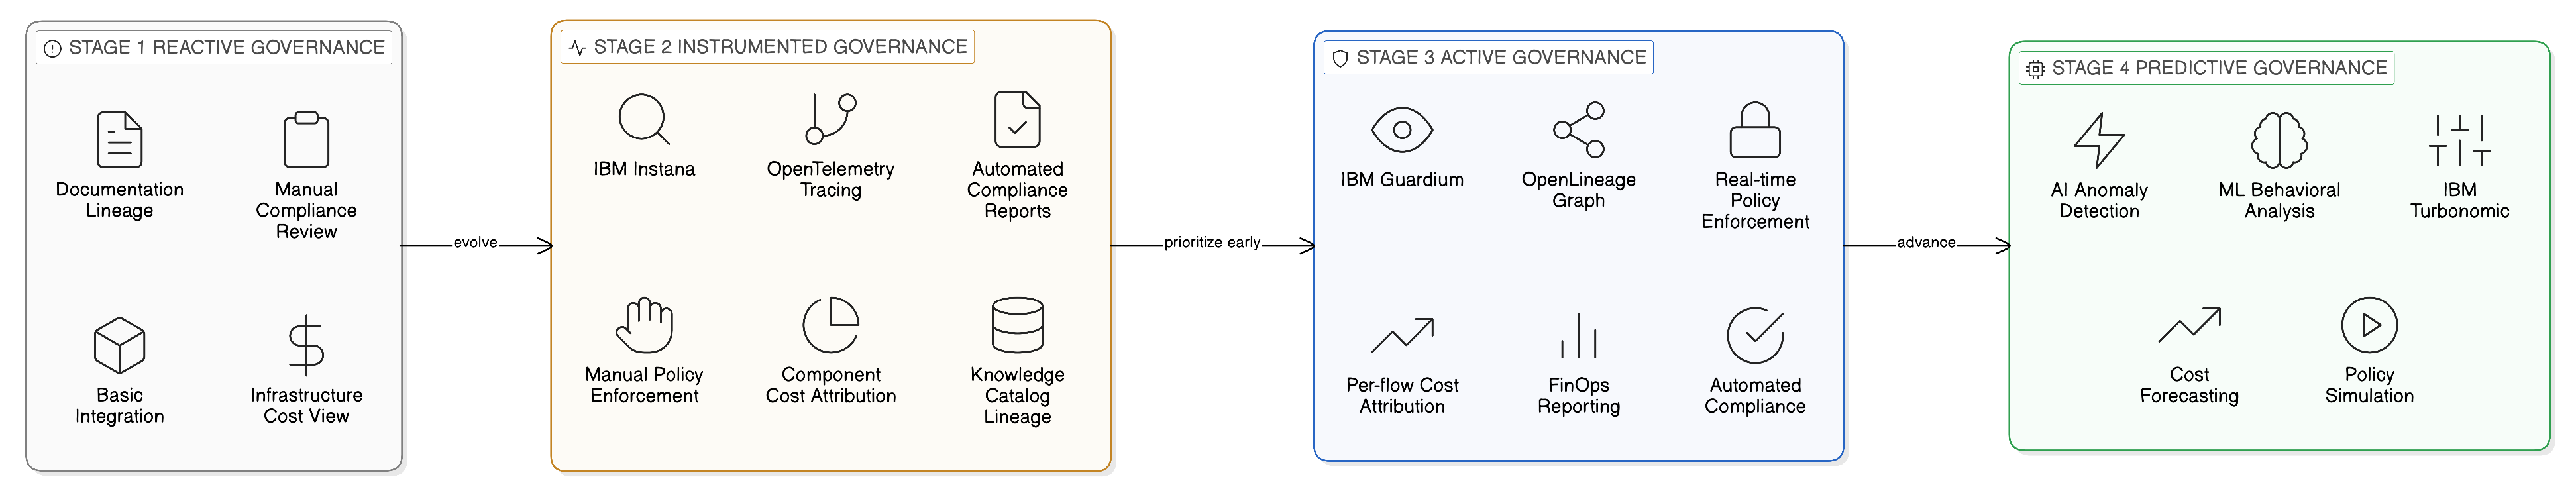
The governance capabilities described in this chapter — access lineage, unified catalogue, active policy enforcement, distributed tracing, AI-powered anomaly detection, independent data access audit, and FinOps cost attribution — represent a mature implementation of governance for a Zero-Copy Integration architecture. Most enterprises will not achieve this level of maturity immediately; they will progress through stages of governance capability development as their Zero-Copy Integration estate matures. Understanding these stages provides the technology leader with a framework for planning governance capability investment and for assessing the current state of their organisation’s governance maturity.
At the first stage of governance maturity, which may be characterised as reactive governance, the enterprise has begun to deploy Zero-Copy Integration components but has not yet established systematic lineage capture, distributed tracing, or cost attribution. Governance is primarily manual: compliance teams review access logs periodically, lineage is reconstructed from documentation rather than captured automatically, and the cost of integration workloads is visible only at the infrastructure level rather than at the flow level. This stage is adequate for small-scale Zero-Copy deployments but will not scale to an enterprise-wide integration estate without generating the compliance gaps and operational opacity that the governance function exists to prevent.
At the second stage, which may be characterised as instrumented governance, the enterprise has deployed the observability infrastructure required to capture lineage events and access logs automatically from all integration components, and has established the data pipelines that aggregate those events into the governance catalogue. IBM Instana is deployed across the integration estate, providing autonomous discovery, automatic agent instrumentation, and OpenTelemetry ingestion for distributed tracing. Compliance reporting is largely automated, lineage is available in the catalogue for most integration assets, and cost attribution is available at the component level. Policy enforcement remains primarily manual, however: governance policies are documented in the catalogue but are not yet enforced programmatically at the point of access.
At the third stage, characterised as active governance, the enterprise has integrated its governance policies into the access path of the integration fabric, so that access decisions are evaluated against catalogue-resident policies in real time. IBM Guardium provides independent, tamper-evident audit of data access at the data source level, correlating with Knowledge Catalog’s governance policies to detect ungoverned access. Lineage capture is comprehensive across all three integration planes, unified in a single graph with OpenTelemetry-enabled cross-plane stitching. Cost attribution is available at the flow level, and FinOps reporting provides domain-level cost summaries incorporated into the enterprise’s technology cost management processes. Compliance reporting is fully automated, and the audit trail generated by the access log and Guardium is sufficient to satisfy regulatory enquiries without manual reconstruction.
At the fourth and most mature stage, characterised as predictive governance, the enterprise has deployed analytics over its lineage and access log data to identify governance risks proactively. IBM Instana’s dynamic baselining and AI anomaly detection identify performance deviations and access anomalies before they manifest as operational incidents. Machine learning models trained on historical access patterns from Guardium’s audit stream identify behavioural anomalies that may indicate a policy violation or a security incident. IBM Turbonomic’s continuous resource management prevents cost overruns and maintains performance targets autonomously. Cost forecasting models project future integration costs based on current growth trends and alert FinOps practitioners to domains whose consumption is accelerating beyond plan. Policy simulation capabilities allow governance teams to evaluate the impact of proposed policy changes on the integration estate before they are deployed, reducing the risk of inadvertent compliance disruption.
The progression from reactive to predictive governance is not a linear journey that every enterprise must complete in sequence. The most valuable capabilities — active policy enforcement, comprehensive lineage capture, and distributed tracing through IBM Instana and OpenTelemetry — should be prioritised early, since they provide the compliance assurance, audit evidence, and operational visibility that are most immediately valuable to both the governance function and the operations team. Cost attribution and FinOps reporting follow naturally as the integration estate grows and the commercial imperative of cost visibility becomes more pressing. Predictive governance, with its AI-driven anomaly detection and autonomous resource management, represents the long-term aspiration: an integration estate that is not merely governed but self-aware, capable of detecting and responding to governance risks and operational anomalies before they manifest as compliance incidents or commercial surprises.
11.8 Summary and Architectural Imperatives
This chapter has examined the observability, lineage, and audit capabilities that the Zero-Copy Integration enterprise requires, and argued that the elimination of replication transforms the governance model from provenance tracing to access lineage without reducing the enterprise’s ability to maintain compliance and operational visibility. The argument developed through the chapter may be summarised in five claims.
First, the shift from provenance lineage to access lineage is not a governance regression but a governance transformation. The Zero-Copy model trades the passive lineage artefacts of copy-centric architectures — extract files, transformation logs, load histories — for active, real-time access lineage records that are more informative, more complete, and more directly relevant to the compliance questions that regulators and auditors ask. The challenge is capturing these access events at scale and in real time; the tooling to do so is mature and available.
Second, the three classes of lineage artefact — data access lineage, API call lineage, and event stream lineage — must be unified in a single governance catalogue to deliver their full compliance value. Disconnected point records from separately managed governance systems cannot answer the cross-plane lineage questions that end-to-end accountability demands. IBM Knowledge Catalog, integrated with the OpenLineage standard, provides the unification layer that assembles these artefacts into a navigable, policy-aware lineage graph.
Third, IBM Instana, in combination with OpenTelemetry distributed tracing and its own purpose-built proprietary agents, provides the operational observability capability that the Zero-Copy integration estate requires: autonomous discovery of all integration components, deep automatic instrumentation through technology-specific sensors, standards-based distributed trace propagation and correlation across integration planes, and AI-powered dynamic anomaly detection that identifies performance deviations before they become operational incidents. This combination of proprietary depth and open standards breadth is the most complete operational observability solution available for a heterogeneous, multi-plane integration architecture.
Fourth, IBM Guardium provides the independent data access audit capability that operational monitoring cannot substitute for: tamper-evident recording of all data access at the data source level, including access that bypasses the governed integration fabric, with policy correlation and anomaly alerting that detect ungoverned access before it becomes a material compliance violation.
Fifth, the FinOps discipline applied to integration — per-flow cost measurement, domain-level cost attribution, and AI-driven capacity management through IBM Turbonomic — is the economic governance complement to data governance and operational observability, and is essential to realising the economic benefits of Zero-Copy Integration in the operational practices of domain teams rather than in the architecture alone.
Several architectural imperatives emerge from this analysis. The first is the deployment of IBM Instana with its full suite of purpose-built integration technology sensors — IBM MQ, IBM App Connect Enterprise, IBM Event Streams, IBM API Connect, and watsonx.data — as the operational observability foundation of the integration estate, supplemented by OpenTelemetry instrumentation for components outside Instana’s direct agent coverage, from the earliest phase of the Zero-Copy integration programme. Retrofitting observability to an integration estate that has grown without it is substantially more difficult and more expensive than building it in from the start, and the operational and compliance value it provides is available immediately upon deployment. The second is the establishment of IBM Knowledge Catalog as the active governance layer — not merely as a passive documentation system — integrated into the access path of the integration fabric so that policies are enforced at the point of access rather than recorded after the fact. The third is the deployment of IBM Guardium as the independent data access audit layer for all data sources that contain regulated personal data, complementing the fabric-level governance of Knowledge Catalog with the database-level audit coverage that regulatory compliance in financial services, healthcare, and personal data processing requires. The fourth is the investment in FinOps capability — per-flow cost measurement, domain attribution, and IBM Turbonomic-driven resource management — as an integral component of the integration governance model rather than a future optimisation activity, ensuring that the economic discipline of Zero-Copy Integration is enforced through operational practice from the outset.
The chapter that follows examines business continuity and disaster recovery in the Zero-Copy enterprise, addressing how the distributed, sovereignty-conscious architecture described in preceding chapters is designed for resilience to the failures and disruptions that operational continuity planning must account for.
If you are finding this content useful, please consider supporting the author's efforts by purchasing a complete digital or hard-copy version.
Zero-Copy Integration: Architecture for the Fragmented Enterprise
© 2026 by Alan Hamilton
is licensed under CC BY-SA 4.0
![]()
![]()
![]()