Chapter 16 — DevOps Insights, Change Risk, and Continuous Quality
Summary
This chapter closes the gap between software delivery performance and operational stability by showing how IBM DevOps Insights aggregates build, test and deployment data from CI/CD toolchains and feeds it into Concert’s risk model as a first-class signal source. It explains the four DORA key metrics, the DevOps Insights data model and quality gate mechanism, and the composite change risk score that Concert calculates from historical failure rates, change scope, quality gate disposition, deployment cadence and sovereign zone modifiers. Architects will find guidance on sovereign-specific quality dimensions including SBOM completeness, dependency vulnerability status, licence compliance and sovereignty constraint checks, as well as the toolchain federation pattern that publishes only aggregate metrics across sovereign zone boundaries while keeping raw delivery data local. The chapter also covers agentic consumption of DevOps Insights data and the quarterly performance review cadence that converts accumulated delivery intelligence into organisational accountability.
16.1 The missing link between delivery and operations
For much of the history of enterprise IT, the pipeline that carried software from development into production and the systems that kept that software running were governed by entirely separate disciplines, measured by different metrics, and staffed by teams with little reason to speak to one another. Development organisations celebrated deployment velocity; operations organisations braced for it. A release that a delivery team counted as a success—on time, on specification, all tests green—could materialise in production as a sequence of incidents, degraded SLOs and frantic rollbacks. Conversely, operations teams that had learned to protect stability through change freezes and heavyweight approval processes could inadvertently starve the organisation of the very improvements it needed.
The DevOps movement was, in its essence, a sustained argument against this partition. Its core claim, documented empirically across thousands of organisations in the DORA research programme, was that the highest-performing organisations achieved simultaneously high delivery throughput and high operational stability—not as a trade-off, but as a consequence of shared practices and shared accountability [1]. The mechanism that enables this shared accountability is an instrumented, telemetry-rich delivery pipeline whose signals are visible to everyone with a stake in the outcome.
IBM DevOps Insights is the component within IBM’s toolchain that closes this gap in practice. It aggregates data from source control, build systems, test frameworks, security scanners and deployment records, and makes that aggregated picture available both to engineers deciding whether to promote a build and to operational intelligence platforms—most directly IBM Concert—deciding how to characterise the risk profile of a given environment. Without this link, Concert’s assessments of operational health would be limited to runtime signals: infrastructure telemetry, application APM data, network flows. With it, Concert can ask a richer and more revealing question: does the recent delivery history of this component give us reason to be more or less confident in its operational stability?
This chapter describes how DevOps Insights works, how it integrates with Concert, and how organisations operating sovereign cloud estates can use it to establish a continuous quality view that spans the full arc from code commit to production behaviour.
16.2 The four DORA key metrics
The empirical foundation for treating delivery performance as an operational concern rests on four metrics developed and refined over nearly a decade of the DORA research programme, beginning with the work that became the book Accelerate [1] and continuing through successive State of DevOps reports [2].
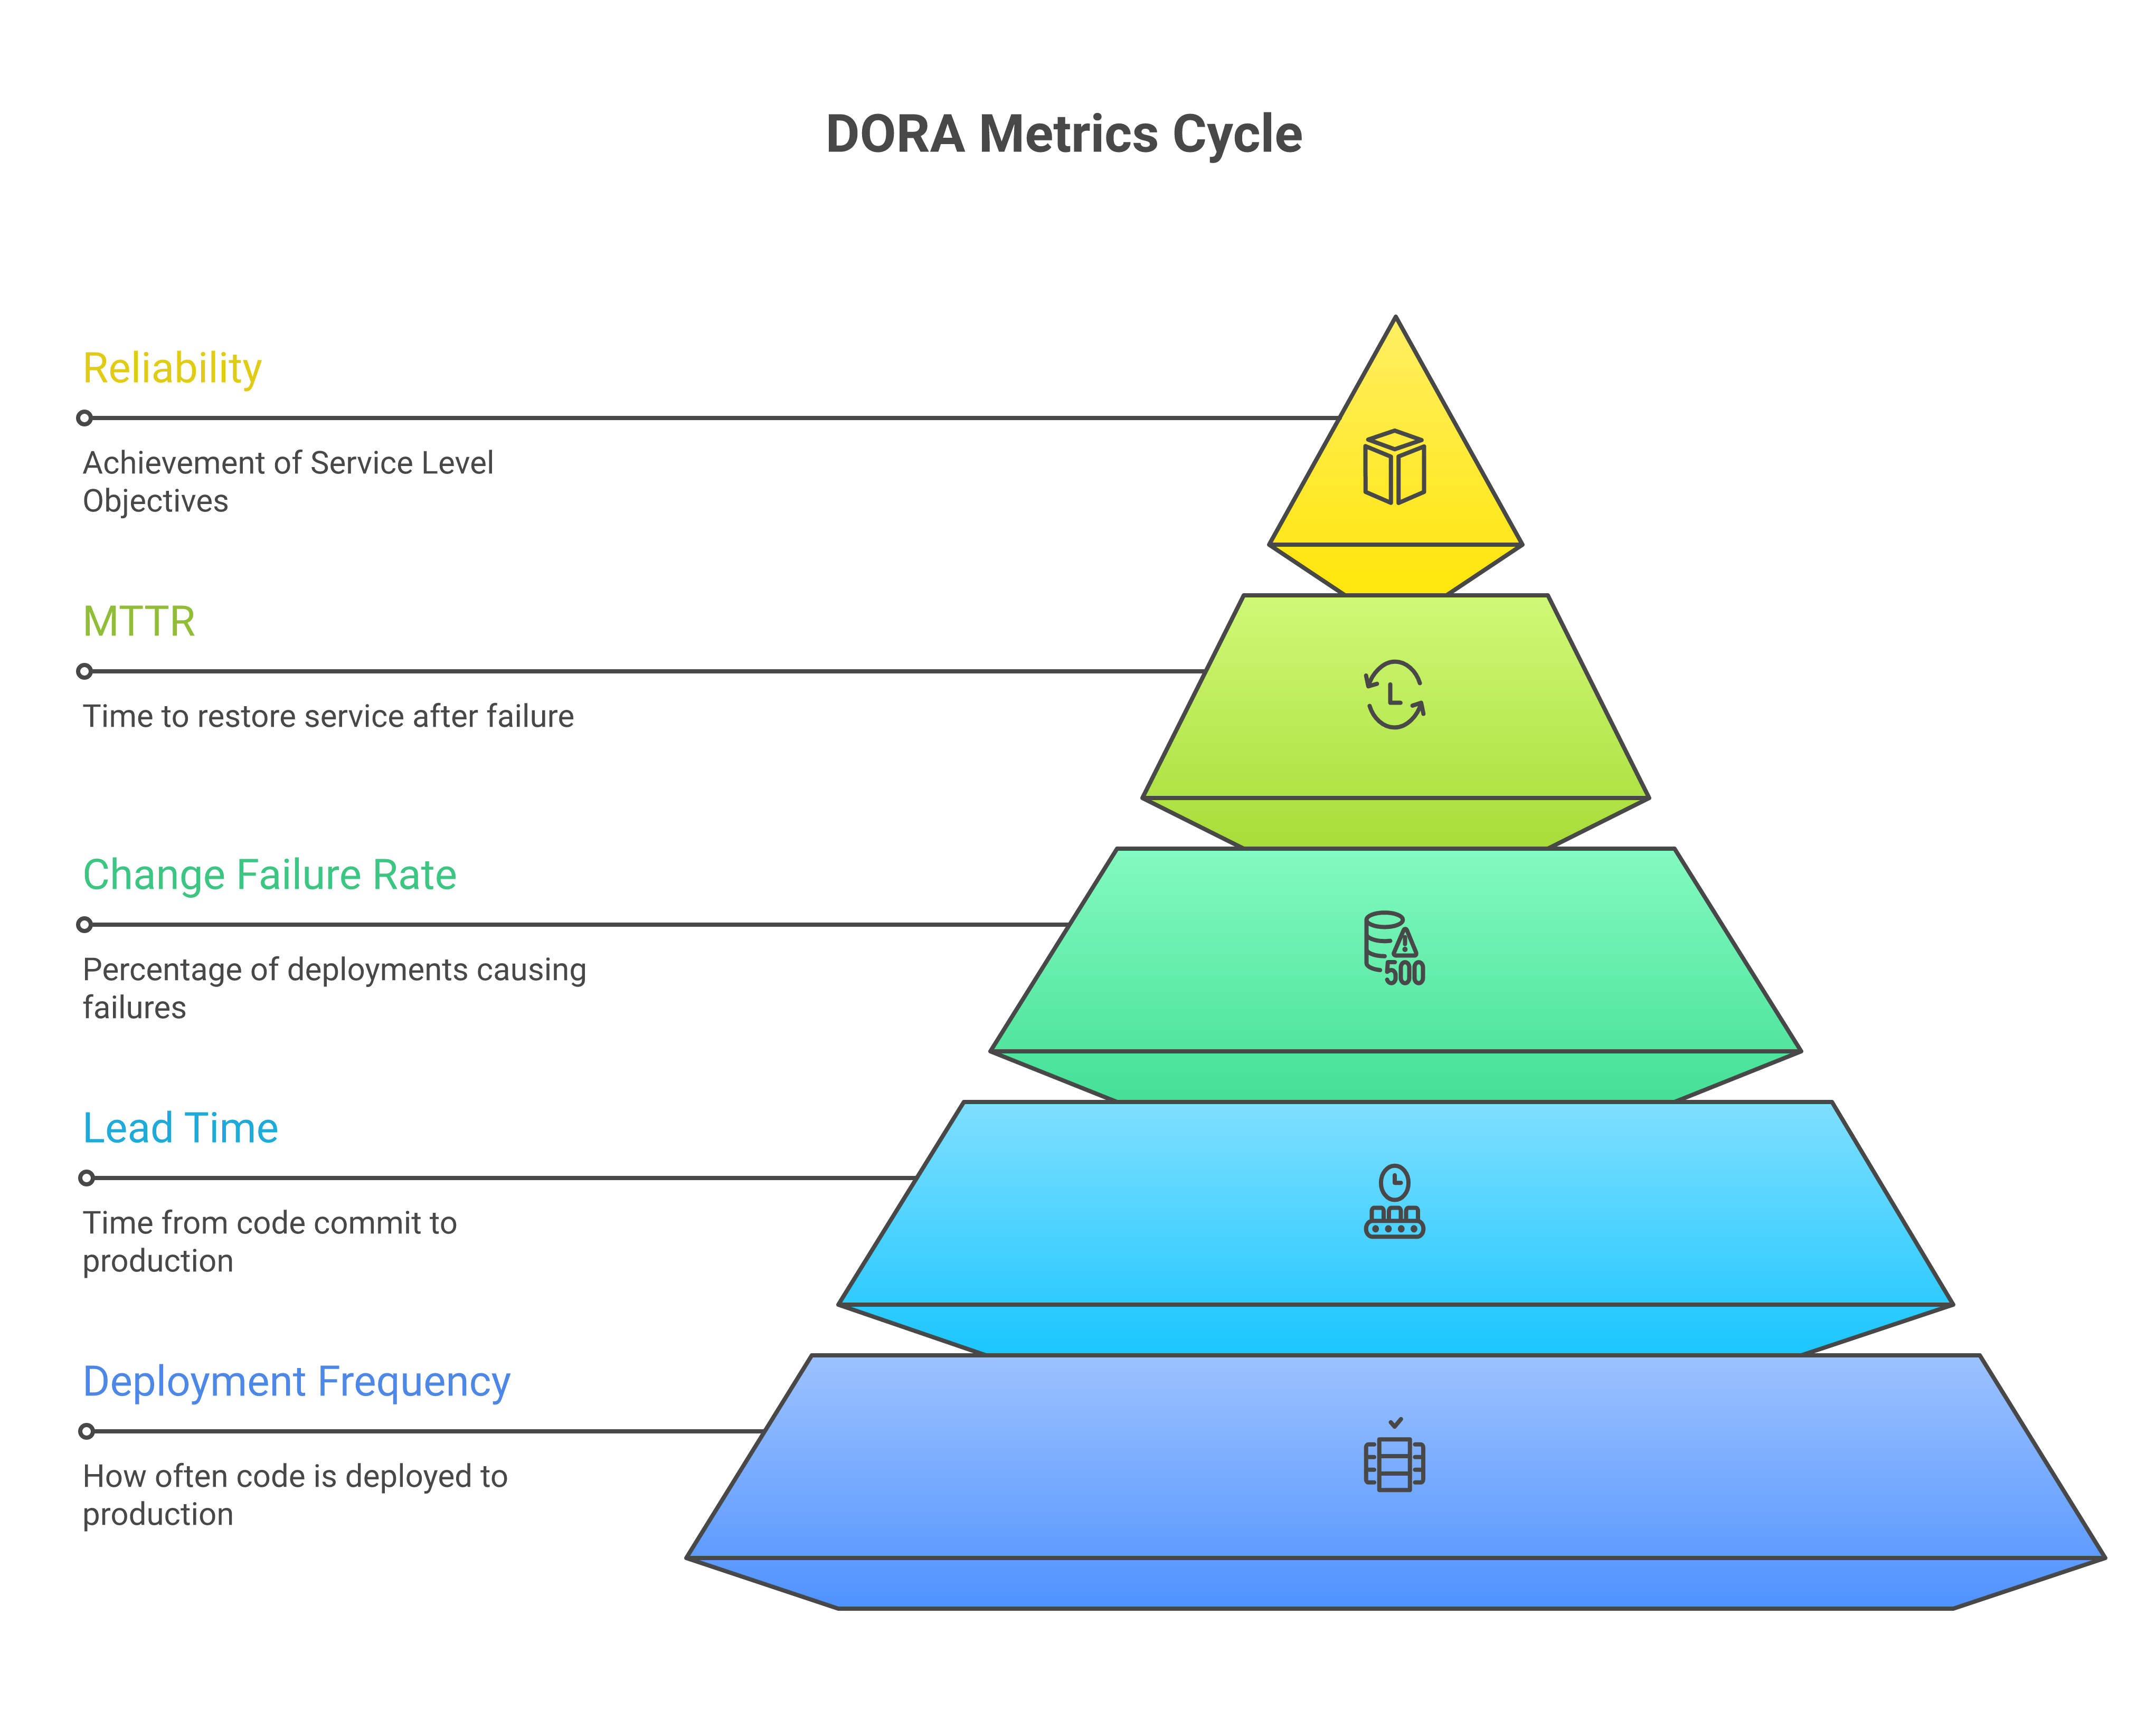
Deployment frequency measures how often an organisation deploys code to production or to a production-like environment. Elite performers deploy multiple times per day, sometimes continuously. Low performers may deploy monthly or less frequently. Deployment frequency is significant not because more is always better, but because it is a lagging indicator of a set of enabling practices: small batch sizes, automated testing, trunk-based development and fast pipeline feedback loops. Organisations that deploy infrequently do so, in the DORA research’s finding, because their processes are slow and risky—not because their software is inherently more complex or regulated.
Lead time for changes measures the elapsed time from the moment a developer commits code to the moment that code is running in production. Again, elite performers achieve lead times measured in hours; low performers in months. Lead time is sensitive to hand-off delays, manual approval gates, long-running test suites and environment provisioning bottlenecks. It is a measure of the friction in the delivery system.
Mean time to restore (MTTR) is the first of the two metrics that lives explicitly in the operational domain. It measures the time required to restore a service to normal operation following a degradation or outage. MTTR is determined partly by how quickly an incident is detected (an observability concern) and partly by how quickly an effective remediation can be applied (a delivery concern: can we produce and deploy a fix in minutes or in days?). Elite performers restore in under one hour. Low performers take between one week and one month [2].
Change failure rate is the proportion of deployments that result in a service degradation requiring remediation—a rollback, a hotfix, or a corrective patch. Elite performers sustain change failure rates between zero and fifteen per cent. High failure rates indicate that changes are entering production inadequately tested, inadequately reviewed, or inadequately staged.
These four metrics resist gaming because they are outcome metrics rather than activity metrics. It is possible to inflate the number of commits, test runs or deployments recorded in a system; it is considerably harder to sustain a short MTTR and a low change failure rate by manipulating data without also actually improving practices. The DORA research consistently finds that teams which score highly across all four metrics simultaneously also report better organisational outcomes: lower burnout, higher employee satisfaction, and stronger business performance [1].
A fifth metric has emerged from more recent DORA work and is increasingly treated as a complement to the original four: reliability, measured as SLO attainment percentage [2]. This metric makes explicit what the original four implied: that operational outcomes, not just delivery throughput, are the ultimate measure of a software system’s fitness. SLO attainment percentage links the delivery pipeline directly to the service-level objectives that govern operational health, and it is through this linkage that DevOps Insights and Concert can exchange the most operationally meaningful signals.
16.3 IBM DevOps Insights: architecture and data model
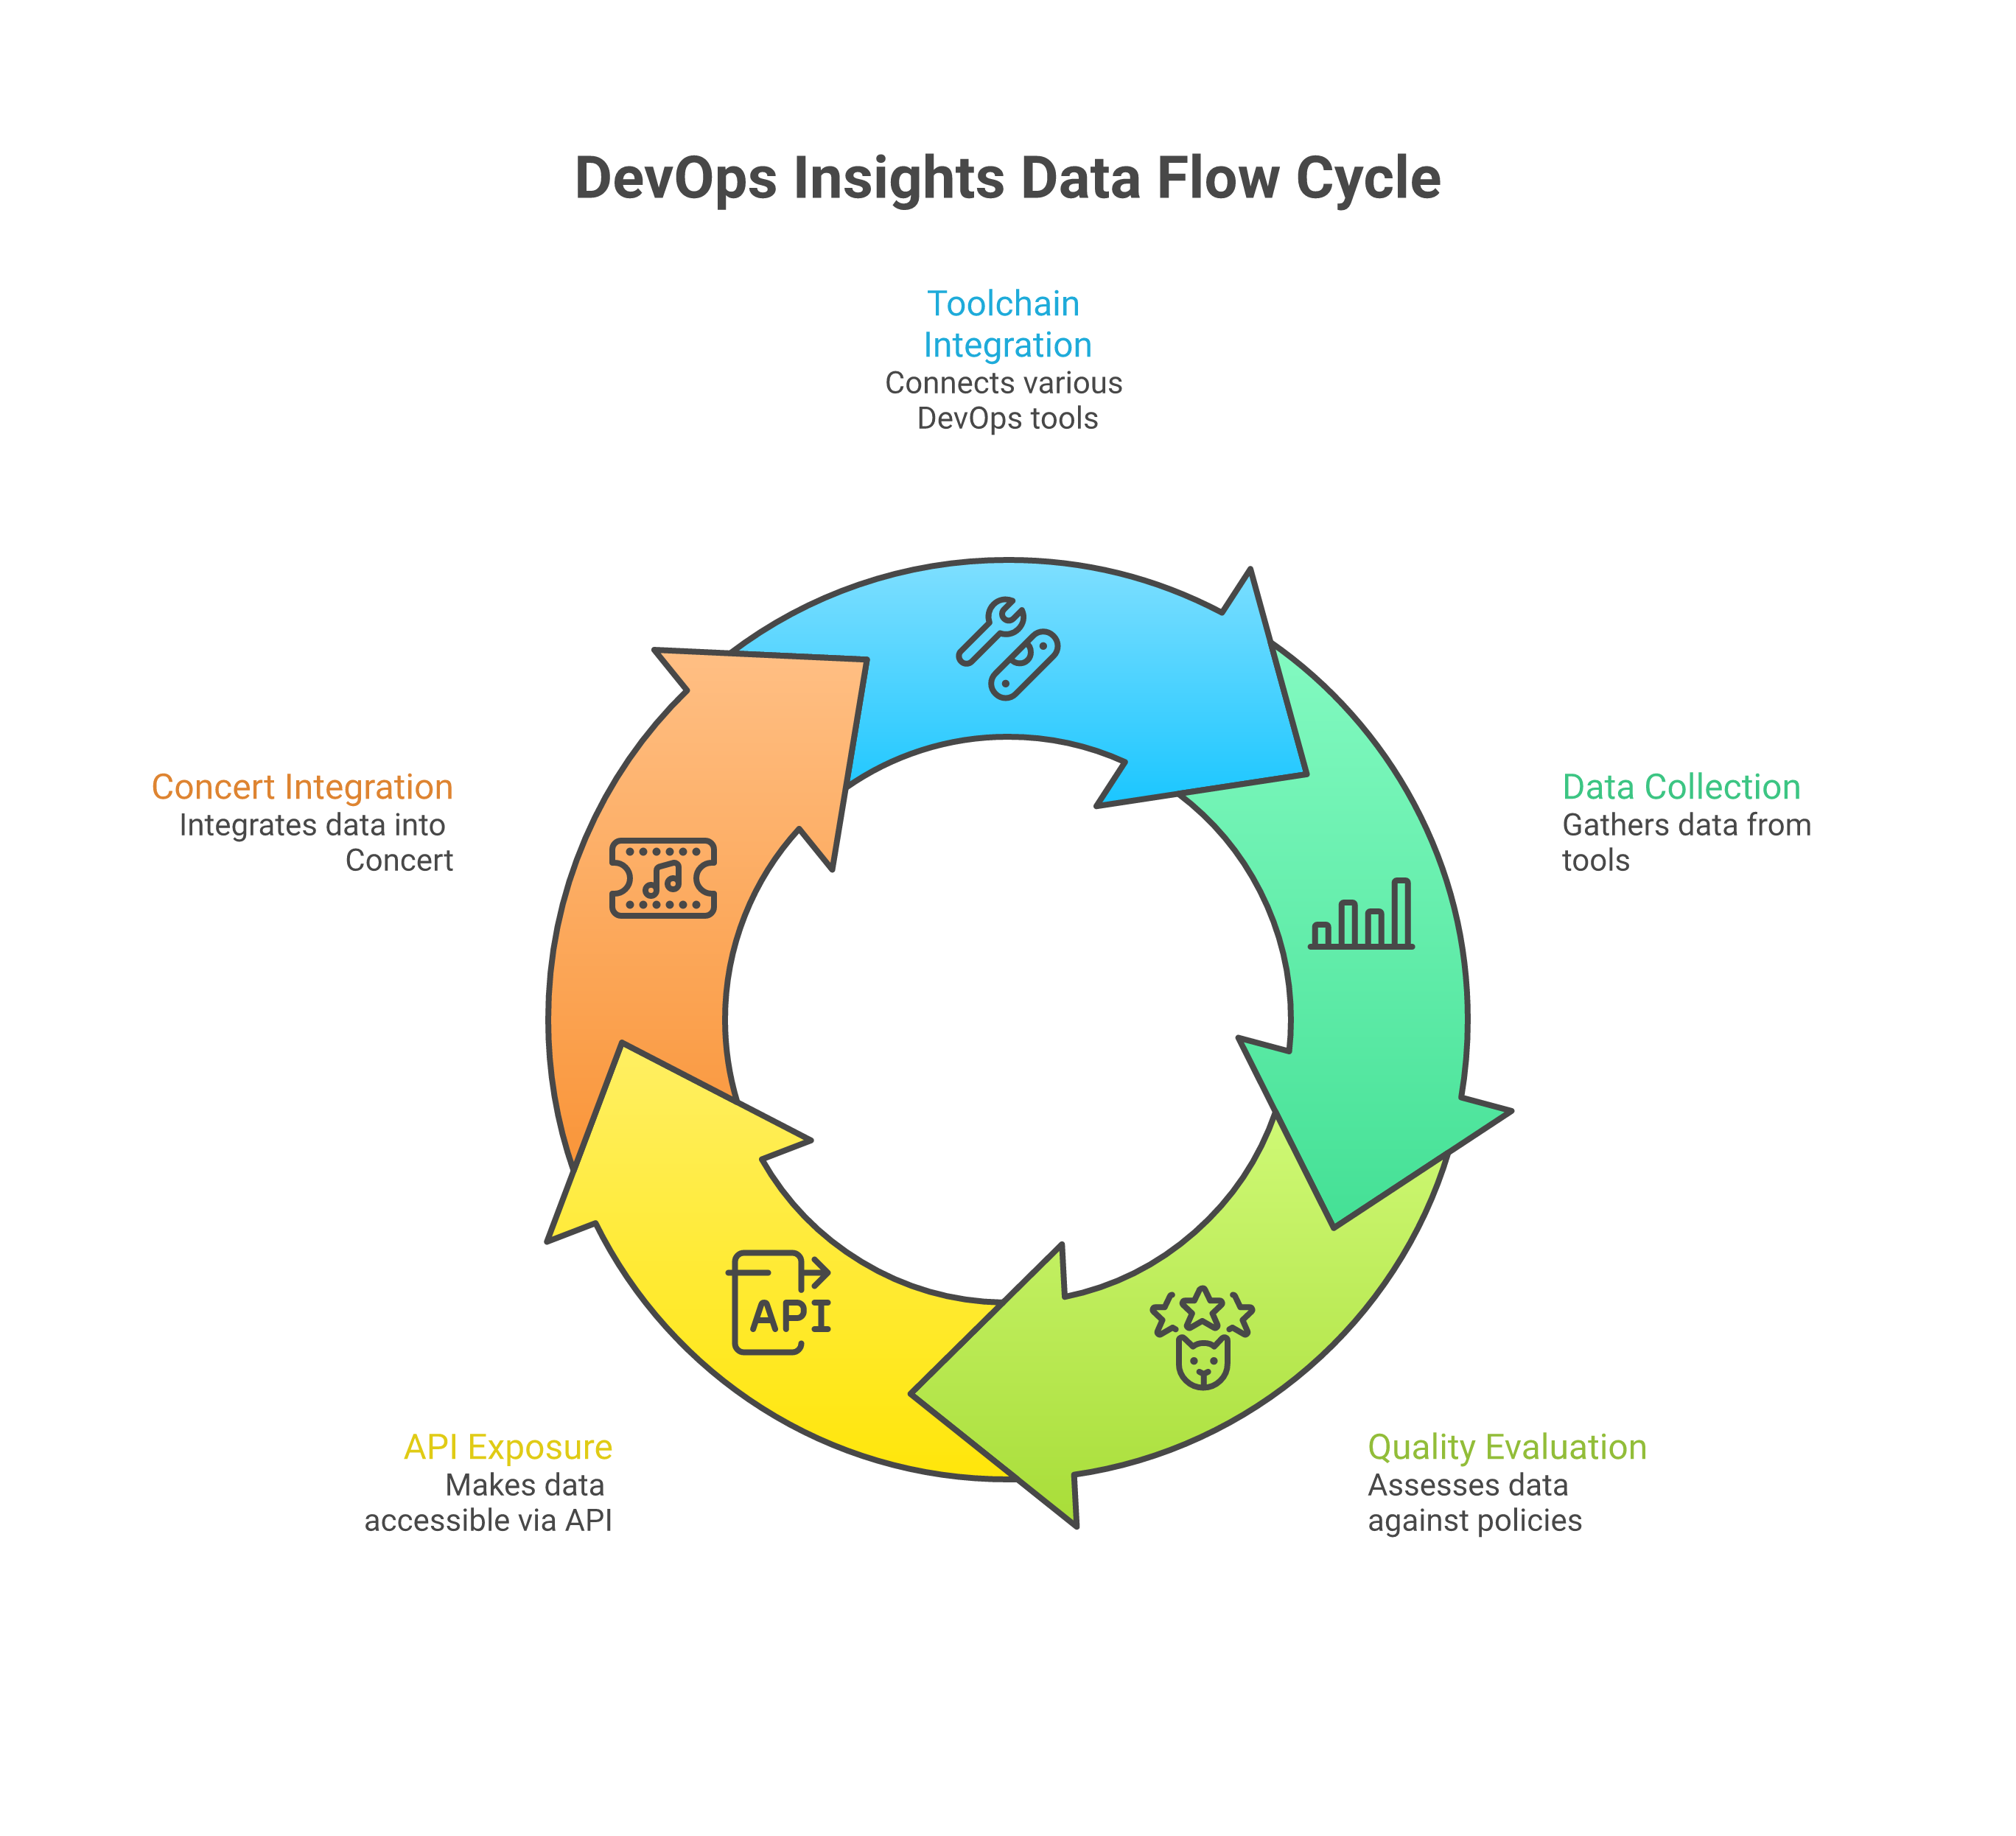
IBM DevOps Insights is a SaaS service, available as part of IBM Cloud Continuous Delivery, that collects, aggregates and analyses data from CI/CD toolchains. Its architecture is built around the concept of a toolchain integration: a configured connection between DevOps Insights and an upstream tool—a build system, a test framework, a deployment orchestrator, or a source control platform.
Supported integrations span the dominant CI/CD ecosystems. Jenkins pipelines publish data to DevOps Insights via a dedicated plugin that transmits build results, test results and deployment records. GitHub Actions workflows use an IBM-provided action available from the GitHub Marketplace. GitLab CI pipelines use a shell-based integration that posts data to the DevOps Insights REST API at the end of each job. Tekton pipelines, which are the native pipeline mechanism on Red Hat OpenShift and IBM Cloud Kubernetes Service, use a Tekton task definition that wraps the same REST API calls [3]. In practice, many sovereign cloud estates will use a mix of these: a Jenkins-based pipeline for legacy services, Tekton for cloud-native workloads, and GitHub Actions for services whose source control lives in GitHub Enterprise.
The data model within DevOps Insights is organised around five primary entities.
A build represents a single execution of a pipeline that compiled source code and produced an artefact. Build records carry a unique build identifier, a reference to the source repository and branch, a timestamp, and a pass/fail status.
A test result is attached to a build and captures the outcome of a test execution. DevOps Insights accepts test results in JUnit XML format, making it compatible with virtually every major testing framework. Test results are classified by test type—unit, functional, integration, performance, or security—and the classification determines which quality gate rules apply.
A deployment record associates a specific build with a specific environment at a specific point in time. The environment identifier is significant: DevOps Insights uses it to calculate deployment frequency and to scope DORA metric calculations to particular environments. In a sovereign cloud estate, environment identifiers should encode sovereignty zone information—distinguishing, for example, deployments to an EU-sovereign Kubernetes cluster from deployments to a non-sovereign development environment—so that DORA metrics can be calculated per sovereign zone rather than globally.
A quality indicator is a structured assessment result attached to a build or deployment. Quality indicators are the extensibility mechanism through which custom data—SBOM completeness scores, licence compliance results, or sovereignty constraint checks—can be introduced into the DevOps Insights data model without requiring upstream tool changes.
A policy is the DevOps Insights entity that governs whether a build or deployment satisfies the conditions required to proceed. Policies are evaluated at quality gates and produce a pass or fail decision.
The REST API is the integration surface through which Concert queries DevOps Insights [3]. It exposes endpoints for retrieving build history, deployment history, DORA metric calculations and quality gate evaluations for a given toolchain, application and environment combination. Concert uses these endpoints during its periodic assessment cycle to enrich its model of each application’s risk profile with delivery performance data.
16.4 Quality gates and deployment policies
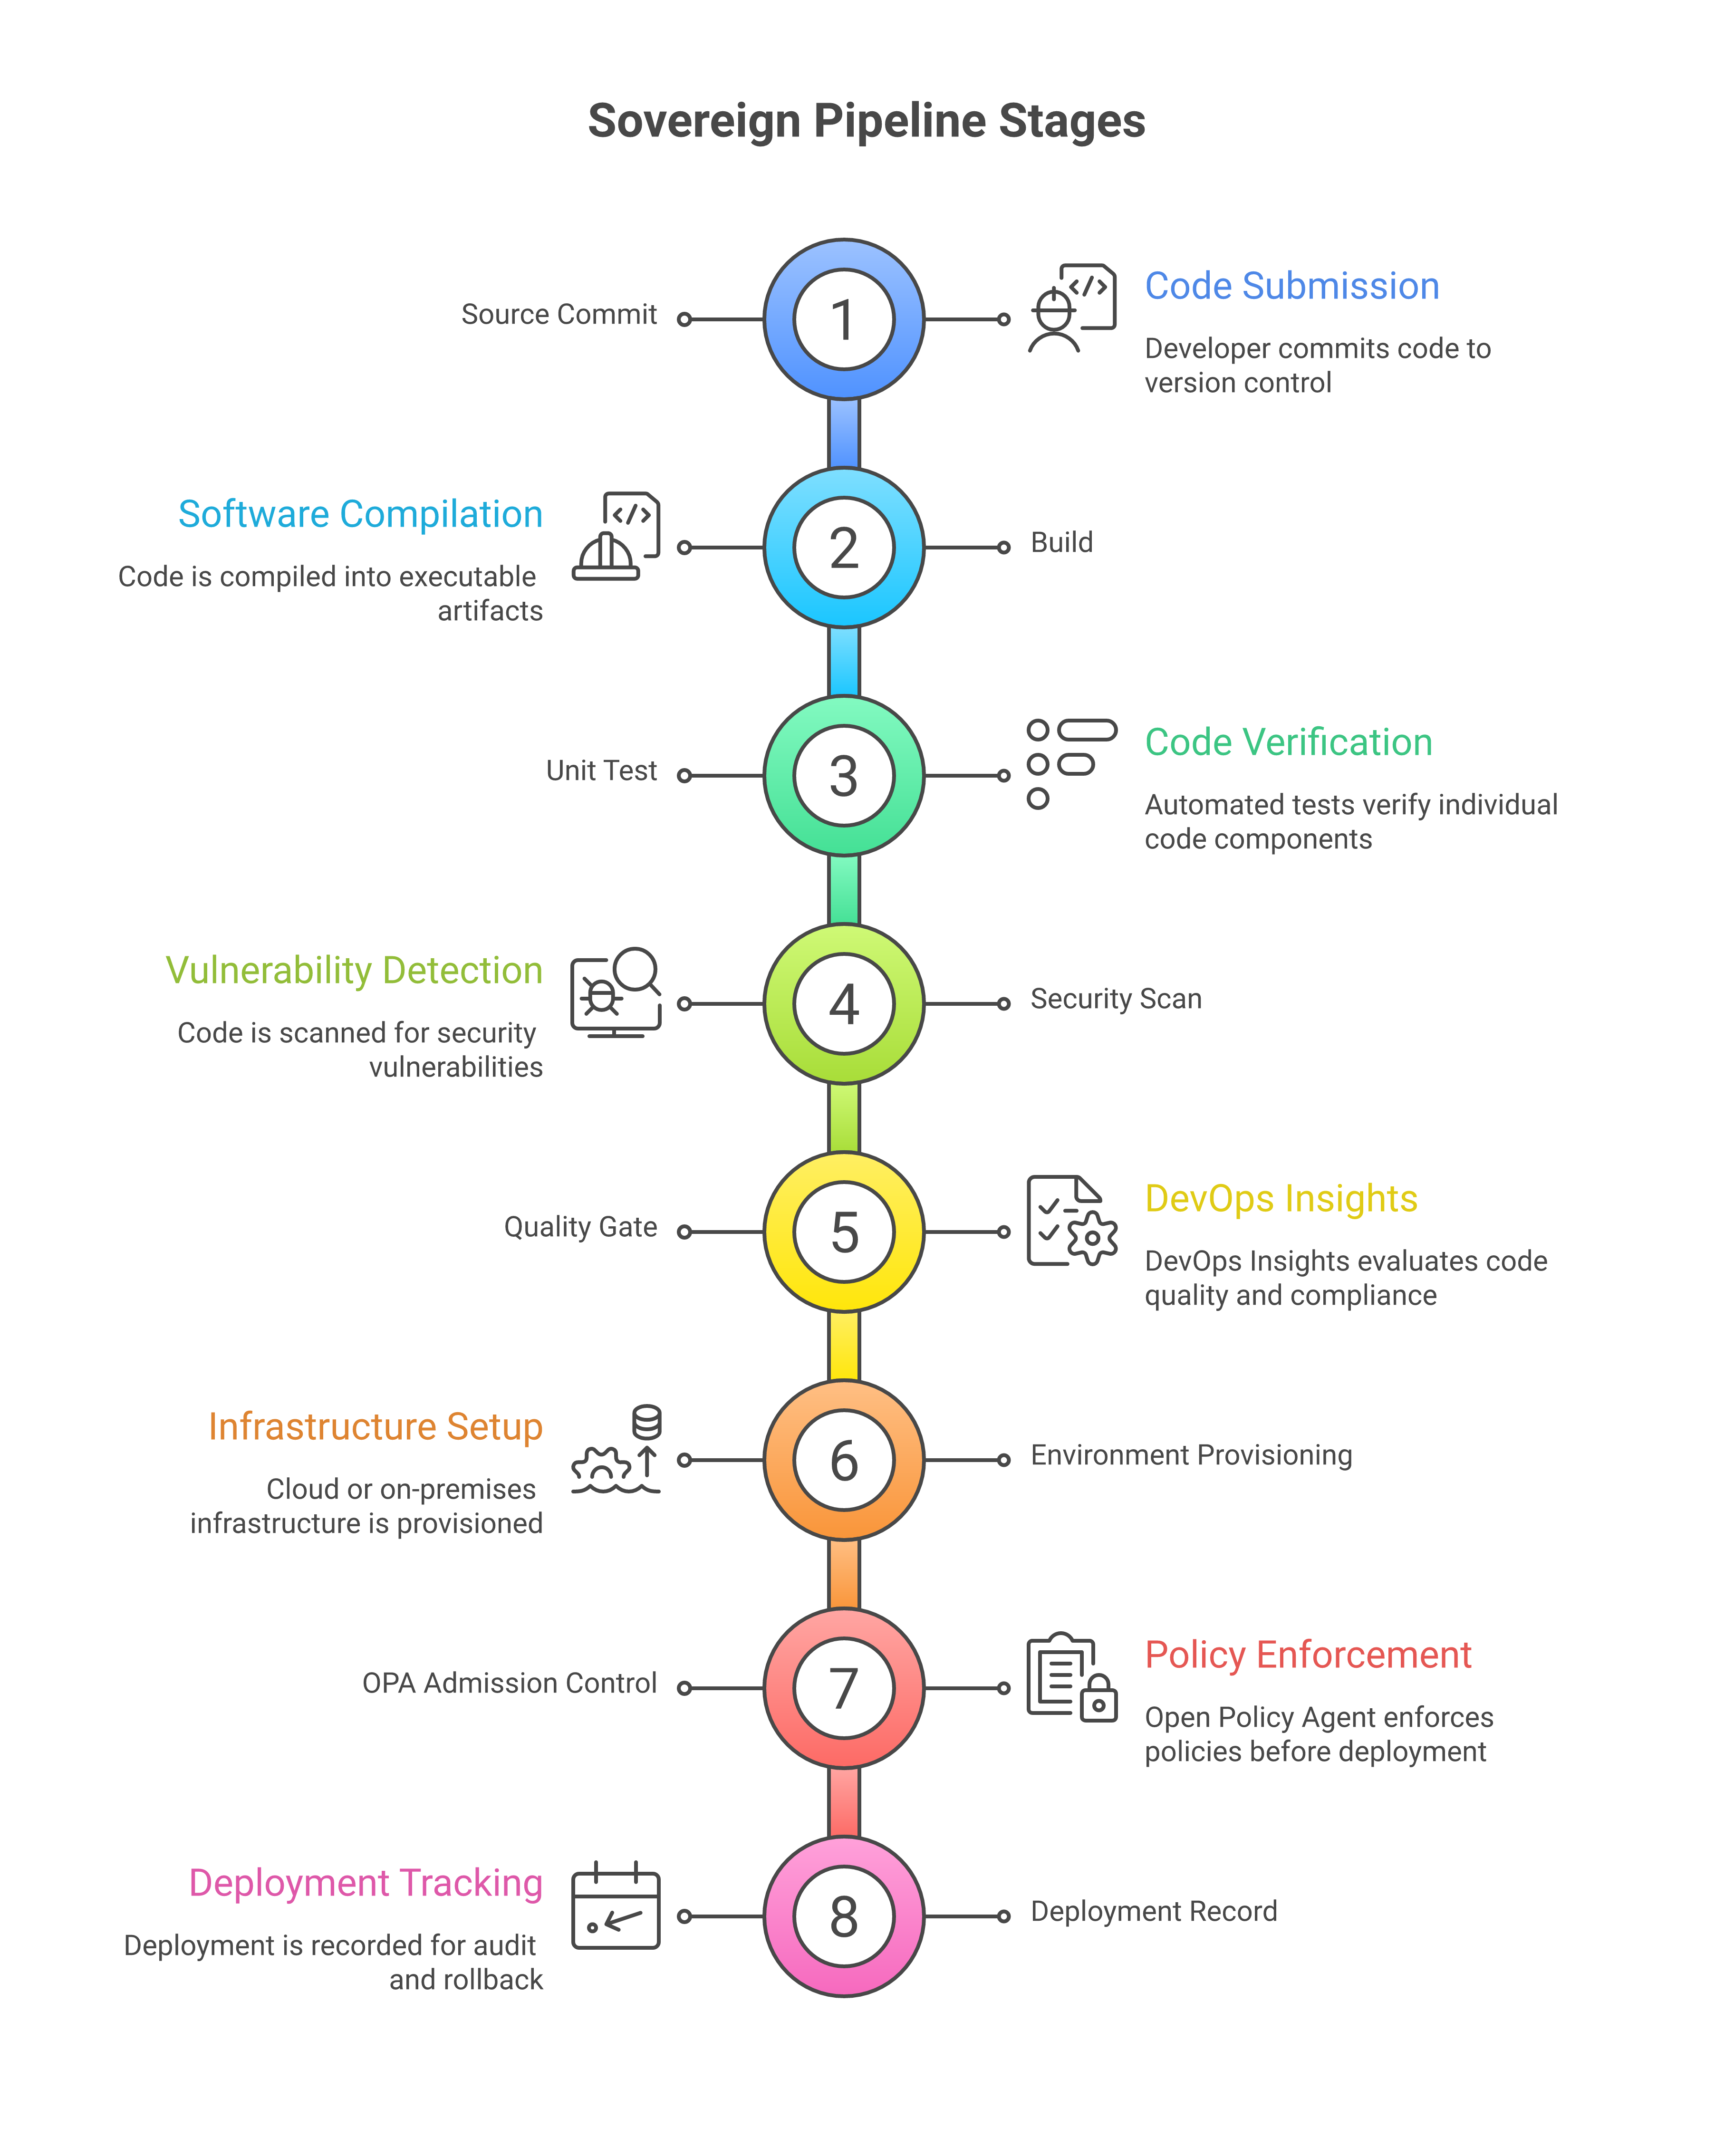
A quality gate is the mechanism by which DevOps Insights converts accumulated data into a deployment decision. It is positioned at a defined stage in the pipeline—typically before promotion from one environment to the next—and evaluates a set of rules against the test results, scan findings and quality indicators associated with the current build. If the rules are satisfied, the gate opens and the pipeline proceeds. If they are not, the gate blocks promotion and the pipeline halts, optionally notifying the relevant team.
Rules within a quality gate are configured to evaluate specific dimensions of quality: minimum test coverage percentage, maximum number of critical security vulnerabilities, maximum proportion of tests failing, or the presence of a completed SBOM. The threshold values are set by platform or security teams and are versioned alongside pipeline configuration, which means that the rules governing a deployment gate are subject to the same review and approval process as any other infrastructure-as-code artefact.
This treatment of quality gates as code is significant for sovereign cloud estates for two reasons. First, it means that quality gate configurations are auditable: regulators or internal auditors can inspect the exact criteria that applied to a given deployment, not merely a human attestation that quality checks were performed. Second, it enables quality gate configurations to be validated before they are applied, using the same tooling used to validate infrastructure configuration—a pre-commit hook, a lint stage in the pipeline, or a policy engine.
The relationship between DevOps Insights quality gates and Open Policy Agent (OPA) / Rego policies is complementary rather than redundant. OPA policies, as described in earlier chapters, govern the structural properties of infrastructure and the runtime behaviour of workloads: whether a container image is permitted in a given sovereign zone, whether a network path violates sovereignty constraints, whether a service account has excessive permissions. DevOps Insights quality gates govern the evidence produced by the delivery process: whether sufficient testing has been performed, whether known vulnerabilities have been remediated, whether artefact provenance can be established.
In a sovereign pipeline, both are active simultaneously. A deployment must satisfy DevOps Insights quality gates—evidence of delivery quality—before it is attempted; it must satisfy OPA policy evaluation—structural and runtime compliance—before it is admitted into the sovereign zone. Neither can substitute for the other. A build that passes all quality gates but deploys a container image to a region outside its permitted sovereign zone will be blocked by OPA. A container image that targets the correct sovereign zone but carries known critical vulnerabilities will be blocked at the quality gate [4].
16.5 Change risk scoring integrated with Concert
IBM Concert ingests operational signals from across the estate—infrastructure health metrics, application performance data, network topology information, incident history—and produces a continuously updated risk assessment for each application and environment in its model. The introduction of DevOps Insights as a data source adds a delivery performance dimension to these assessments.
The integration operates through the DevOps Insights REST API. During each assessment cycle, Concert queries DevOps Insights for recent deployment history, DORA metric calculations and the most recent quality gate evaluation results for each application in Concert’s inventory. This data is incorporated into Concert’s risk model alongside runtime signals.
The change risk score produced by DevOps Insights captures the estimated probability that a specific proposed change will cause a production degradation. It is calculated from a combination of factors: the historical change failure rate for the application, the characteristics of the specific change (size, scope, which components are affected), and the results of quality gate evaluation for the current build. A change targeting a frequently modified, well-tested component with a clean quality gate evaluation will receive a lower risk score than a change touching rarely modified infrastructure code with incomplete test coverage and outstanding security findings.
Concert uses this change risk score to augment its own assessment of operational risk. An application that shows healthy runtime signals—SLO attainment above threshold, no recent incidents, stable resource consumption—but has experienced a deployment in the past twenty-four hours with an elevated change risk score will be flagged for increased monitoring. Concert can surface this situation to operations teams through its interface, correlating the timing of the deployment with any subsequent changes in runtime behaviour.
The integration is bi-directional in the sense that Concert’s operational findings can also influence what DevOps Insights recommends. When Concert identifies a pattern of incidents correlated with deployments of a particular component, it can push that information back into the DevOps Insights risk model, causing subsequent deployments of that component to receive elevated risk scores even if quality gate criteria are nominally satisfied. This feedback loop—production incidents informing delivery risk assessments, delivery risk assessments informing operational monitoring posture—is what distinguishes a genuinely integrated DevOps system from a collection of loosely coupled tools.
Risk score calculation and thresholds
The change risk score is not a single number derived from a single formula; it is a composite that Concert calculates by weighting several contributing factors and normalising the result onto a scale that operations teams can interpret and act upon. Understanding the contributing factors and their weights is essential for teams that wish to calibrate the score to their own risk appetite rather than accepting a default that may not reflect the operational realities of their estate.
The first contributing factor is historical change failure rate, scoped to the specific application and environment combination. Concert retrieves from DevOps Insights the deployment records and incident correlations for the trailing ninety-day window and calculates the proportion of deployments that were followed by a service degradation within a configurable attribution window—typically four hours, though sovereign estates with slower feedback loops may extend this to twenty-four. An application whose change failure rate over the window exceeds fifteen per cent receives an elevated base risk score regardless of other factors.
The second factor is change scope, derived from the build metadata that DevOps Insights attaches to each deployment record. Change scope encompasses the number of files modified, the number of distinct components affected, and whether the change touches configuration, application logic, or infrastructure definitions. A change that modifies a single application module with high test coverage contributes less to the composite score than one that modifies shared libraries consumed by multiple services, because the blast radius of a failure in the latter case is inherently wider.
The third factor is quality gate disposition. A build that has passed all quality gate rules at the highest configured threshold contributes a negative adjustment to the risk score—effectively reducing it. A build that has passed with one or more overridden rules contributes a positive adjustment proportional to the severity of the overridden rules. A build that has bypassed quality gates entirely—permissible in some emergency change workflows—receives the maximum positive adjustment for this factor.
The fourth factor is deployment cadence deviation. Concert compares the timing and frequency of the current deployment against the application’s established deployment rhythm. A deployment that occurs within the normal cadence—for example, a weekly release on Tuesday morning—receives no cadence adjustment. A deployment that occurs outside the normal cadence—an unscheduled Friday evening release, or the third deployment in a day for an application that normally deploys weekly—receives an elevated cadence adjustment. The DORA research consistently shows that unscheduled, off-cadence deployments carry higher failure risk [7].
For sovereign zones, an additional sovereignty risk modifier is applied. This modifier elevates the composite score for any deployment targeting a sovereign production environment, reflecting the higher consequence of failure in environments subject to regulatory oversight. The magnitude of the modifier is configurable per sovereign zone and per regulatory regime: a zone governed by critical infrastructure regulations may carry a modifier of 1.5, while a sovereign development environment may carry no modifier at all. The modifier ensures that the same change, deployed to a non-sovereign staging environment and to a sovereign production environment, will receive different risk scores—and therefore different levels of operational scrutiny.
Concert maps the final composite score onto three thresholds that determine the operational response. A score below the low-risk threshold (configurable, typically below 30 on a 0–100 scale) proceeds with standard monitoring. A score between the low-risk and elevated-risk threshold (typically 30–65) triggers enhanced post-deployment monitoring: shorter SLO evaluation windows, more aggressive anomaly detection sensitivity, and automatic notification to the on-call engineer. A score above the elevated-risk threshold triggers a high-risk protocol that may include mandatory change advisory board review, pre-positioned rollback automation, and real-time SLO tracking with automatic rollback if degradation is detected within the attribution window [3].
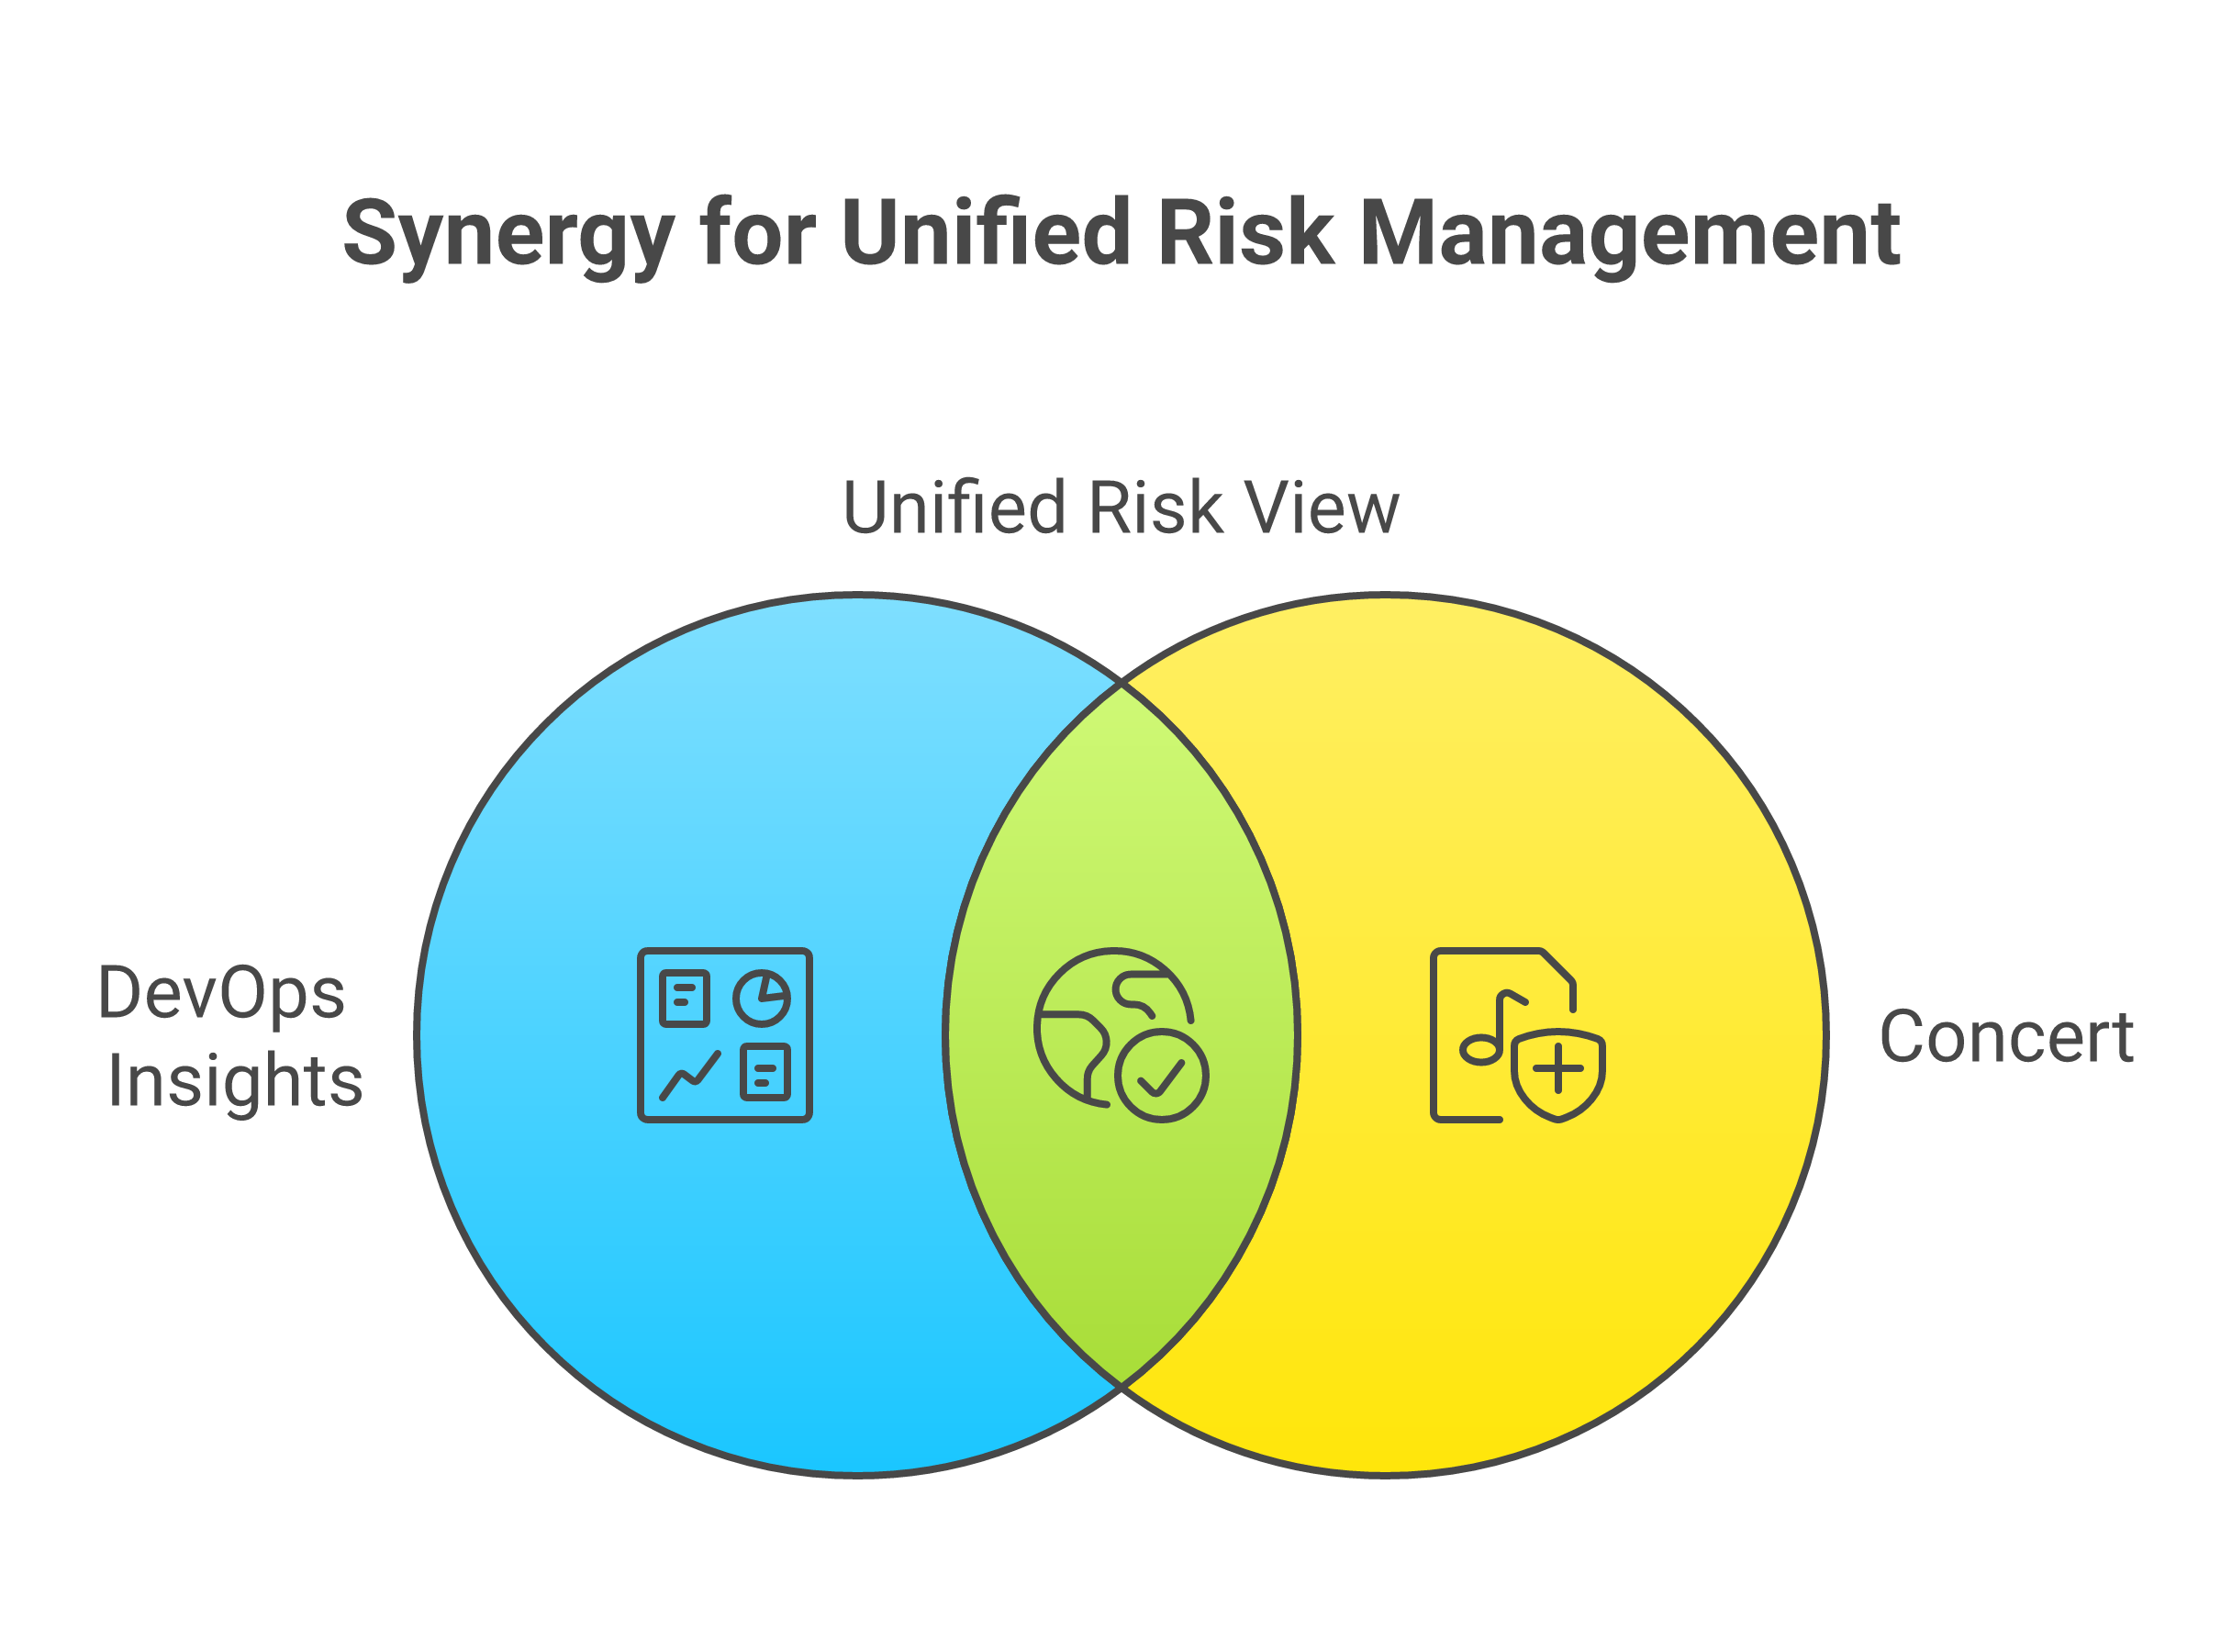
The unified risk view that results from this integration surfaces three distinct categories of signal in a single place. Runtime health signals—SLO attainment, error rates, latency, infrastructure capacity—reflect the current state of the environment. Change history signals—recent deployment frequency, change failure rate, time since last deployment—reflect the delivery team’s recent operating pattern and its stability. Quality gate history signals—test coverage trends, vulnerability age, SBOM completeness—reflect the underlying health of the delivery process. Each category can tell a reassuring story while one of the others tells a concerning one, which is precisely why the unified view exists.
16.6 Continuous quality for sovereign pipelines
The four DORA metrics describe software delivery performance in terms that are deliberately general. They apply equally to a consumer mobile application and to a regulated financial transaction processing system. Sovereign cloud estates, however, impose additional quality dimensions that the standard DORA framework does not address directly.
SBOM completeness is the first sovereign-specific quality dimension. A Software Bill of Materials catalogues the components—libraries, frameworks, base images—that constitute a software artefact. For regulated workloads, the ability to enumerate exactly which components are present in a given production deployment is both a supply chain security requirement and, increasingly, a regulatory one. DevOps Insights can accept SBOM documents in CycloneDX [5] or SPDX [6] format as quality indicators, enabling quality gates to evaluate not only whether an SBOM is present but whether it is complete, covers all dependency depths, and has been generated from a verified build.
Dependency vulnerability status extends the SBOM into operational intelligence. A build that produces a complete SBOM can have that SBOM evaluated against current vulnerability databases—the National Vulnerability Database, for instance, or vendor-specific advisory feeds. DevOps Insights quality gates can be configured to block deployments carrying components with vulnerabilities above a specified severity threshold, and to require that vulnerability exceptions be documented and approved before a gate can be overridden.
Licence compliance is a quality dimension that receives less attention in generic DevOps literature but is acutely relevant in sovereign and public-sector contexts. The licence terms of open-source components may restrict commercial use, require source disclosure, or impose conditions that conflict with the terms under which a sovereign cloud operator holds its data. DevOps Insights, extended with custom quality indicators from a licence scanning tool, can surface these conflicts at the quality gate before a component reaches production.
Sovereignty constraint compliance is the most sovereign-specific quality dimension of all. It addresses the question: has this artefact been built and validated in a way that is consistent with the sovereignty zone it is destined to occupy? This encompasses the deployment target region, the registry from which base images are drawn (which must itself be within the sovereign boundary), the signing authorities that have attested to the artefact’s provenance, and any export control classifications that apply to the component or its dependencies. These checks cannot be performed by the runtime admission control system alone; they must be embedded in the delivery process so that problems are caught before promotion rather than at admission.
The NIST Secure Software Development Framework (SSDF), codified in NIST SP 800-218 [4], provides a reference structure for these practices. The SSDF organises software development security practices into four groups: Prepare the Organisation, Protect the Software, Produce Well-Secured Software, and Respond to Vulnerabilities. DevOps Insights quality gate configurations can be mapped to SSDF practices, enabling organisations to demonstrate evidence-based compliance with the SSDF through the artefact record maintained in DevOps Insights rather than through manual documentation.
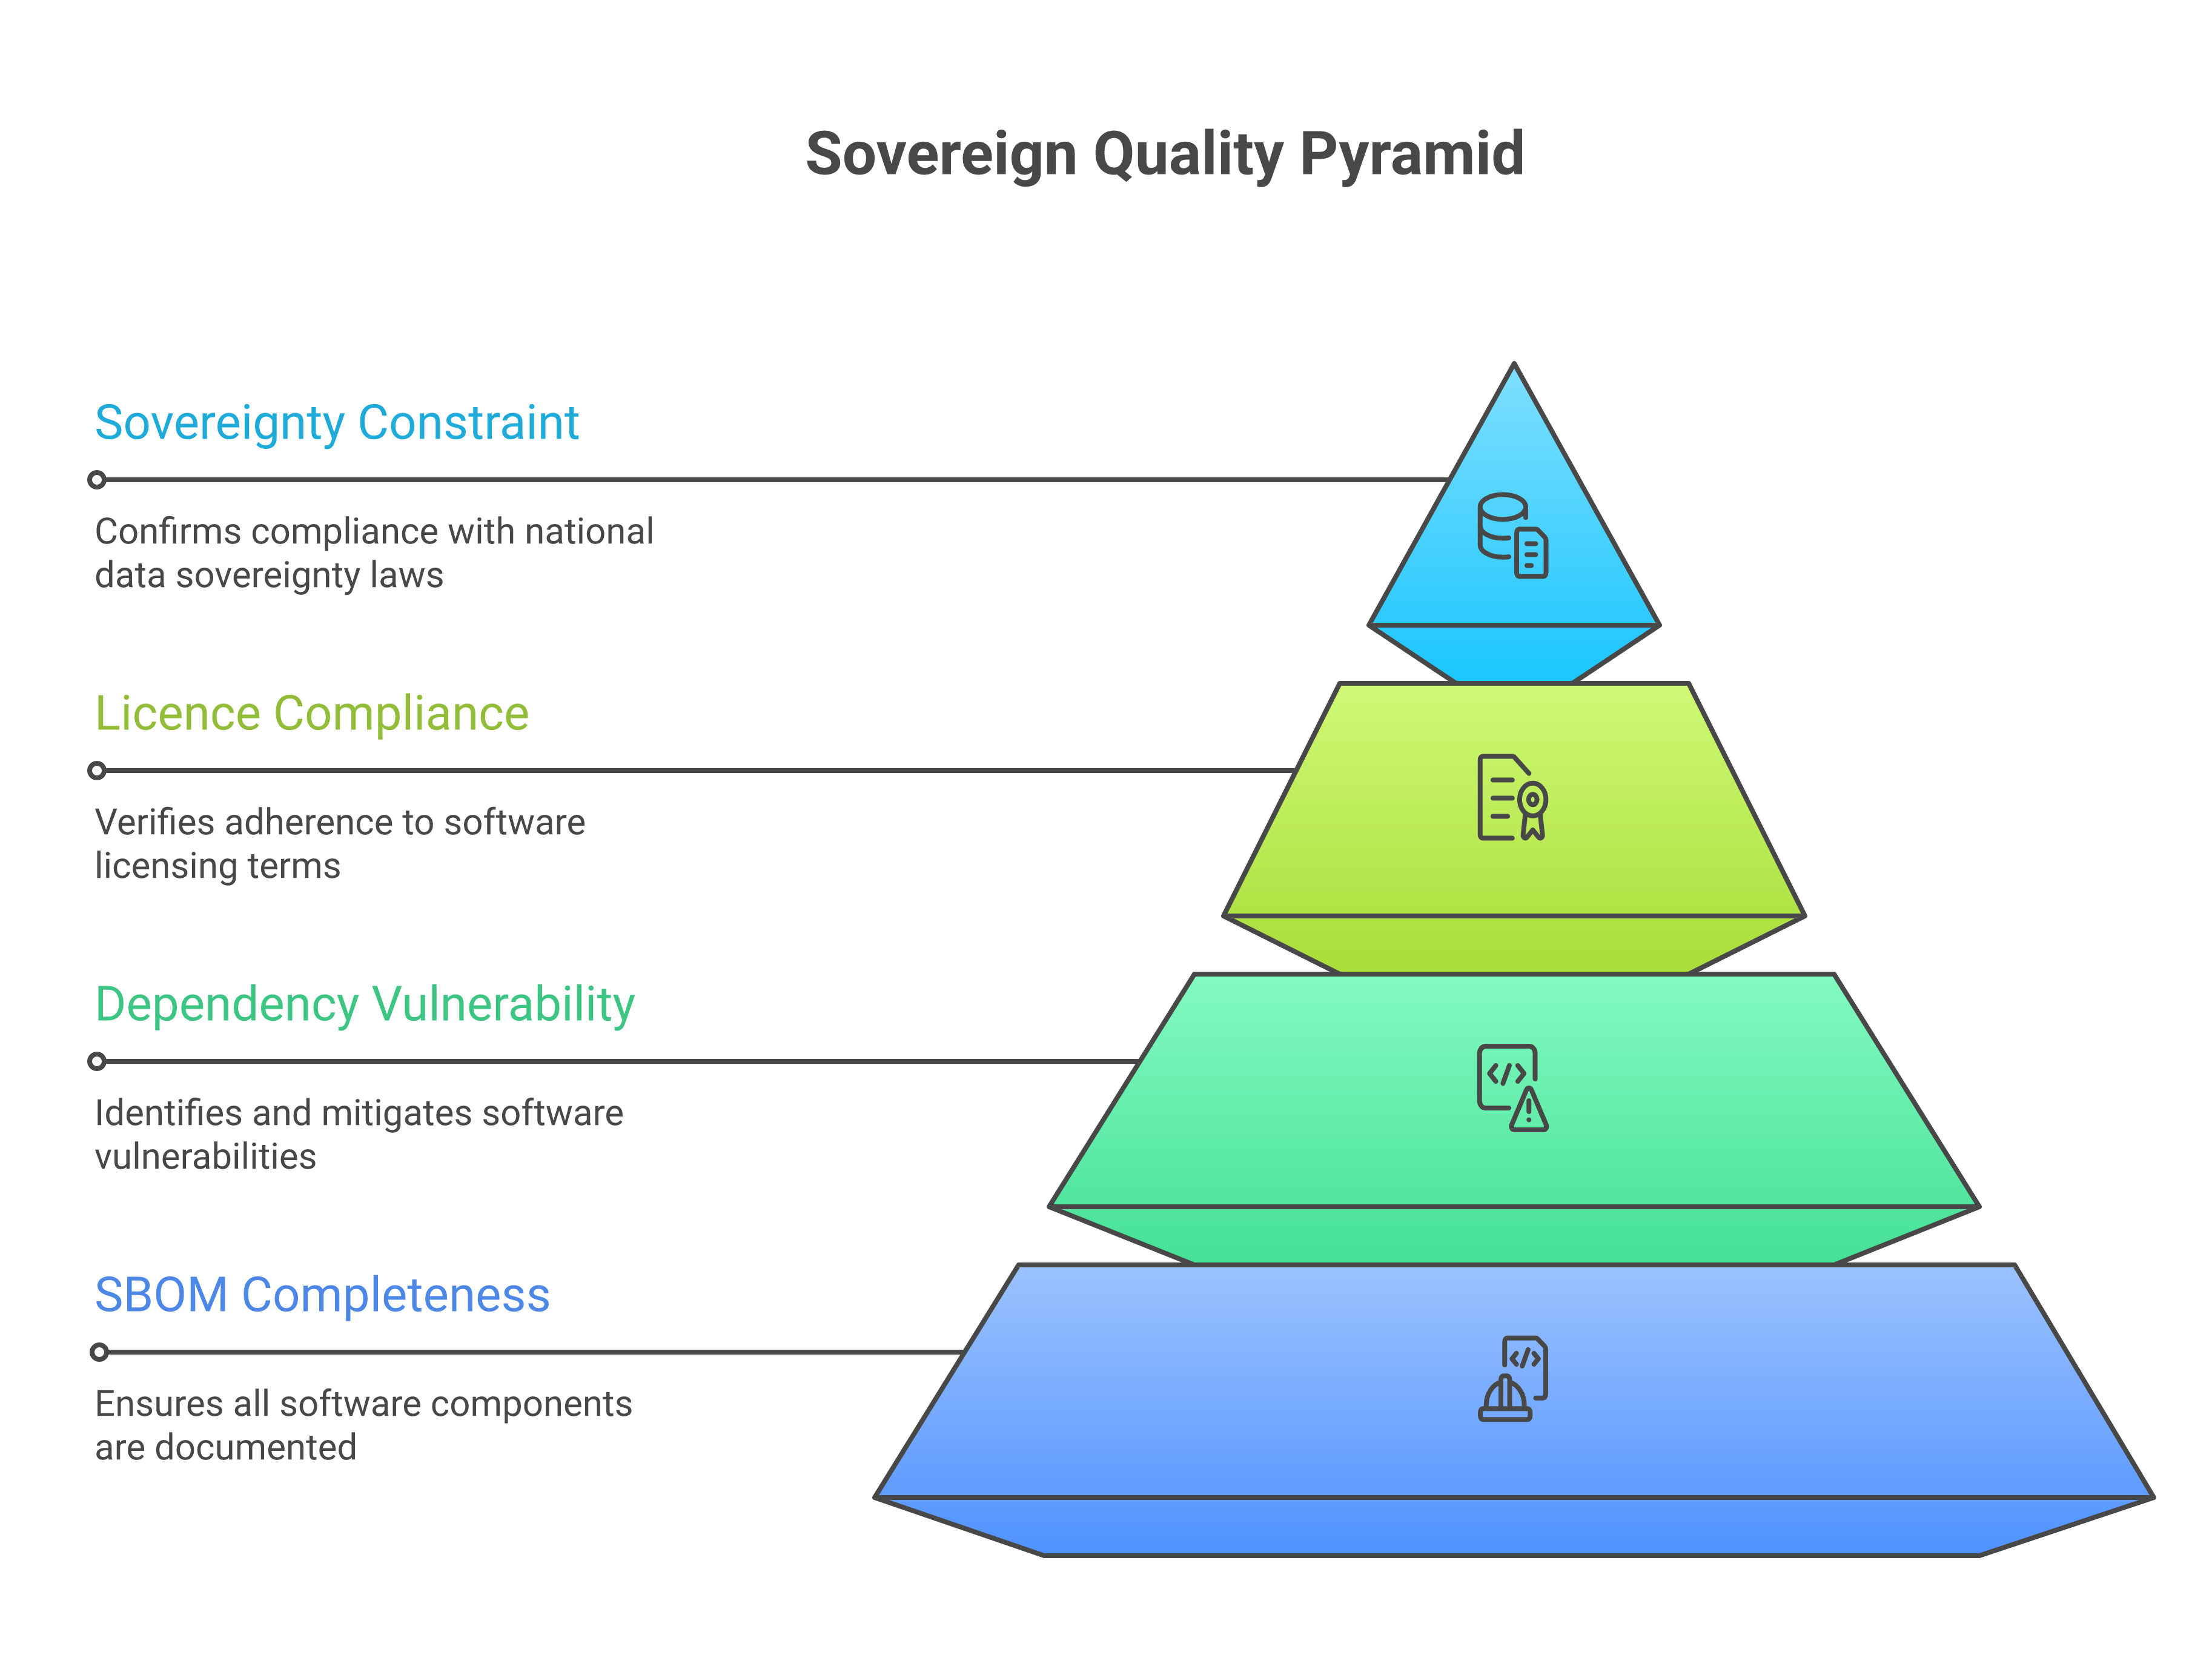
Custom quality indicators are the mechanism through which these sovereign dimensions are introduced into DevOps Insights without modifying the core data model. A quality indicator is a structured JSON document posted to the DevOps Insights REST API by any pipeline step that can produce a relevant result. A custom step in a Tekton pipeline, for example, might run a sovereignty constraint check against the deployment target metadata and post the result as a quality indicator named sovereignty-compliance. A quality gate rule can then evaluate that indicator, blocking promotion if the check has not been performed or if it has returned a non-passing result.
This extensibility is what allows DevOps Insights to serve as the central quality ledger for a sovereign pipeline, even when the specific quality checks required by a sovereign estate extend well beyond what any commercial toolchain anticipated.
16.7 From quality data to operational learning
The data accumulated in DevOps Insights over weeks, months and years of pipeline execution constitutes one of the richest sources of operational intelligence available to an engineering organisation. The challenge is to use it systematically rather than opportunistically—to convert a log of delivery events into a continuously improving understanding of what produces stable, secure, sovereign production systems.
Post-incident review correlation is the first and most immediate use of delivery history for operational learning. When an incident occurs, one of the earliest and most valuable questions is: what changed? DevOps Insights provides a precise, time-stamped record of every deployment to every environment, linked to the specific builds and test results that accompanied each deployment. A post-incident review that draws on this record can correlate the incident timeline against the deployment timeline and identify with precision whether a recent deployment is a plausible contributing cause. If the deployment record shows that a change was promoted with a quality gate override—bypassing a failing rule under a documented exception—that information is directly relevant to understanding why a problem reached production.
This correlation is most powerful when DevOps Insights and Concert share a common incident model. Concert records incidents against specific applications and environments; DevOps Insights records deployments against the same identifiers. A Concert incident review screen that surfaces the deployment history of the affected application—including quality gate results and change risk scores—gives operations engineers the context they need to form and test causal hypotheses without switching tools.
Trend analysis operates over longer time horizons and looks for deteriorating quality indicators before they manifest as incidents. A gradual decline in test coverage for a component, sustained over a quarter of increasing deployment velocity, is a leading indicator of elevated change failure risk. A persistent set of security findings that are consistently marked as accepted exceptions rather than remediated is a sign that the quality gate is being used as a compliance tick-box rather than a genuine control. DevOps Insights trend data, surfaced in Concert’s risk model, can prompt proactive intervention—a conversation with the relevant team, a targeted review of the exception register, an adjustment of quality gate thresholds—before the latent risk becomes an operational event.
A/B analysis of testing strategies is a less commonly exploited application of delivery history data that becomes tractable when deployment records are sufficiently rich. If one team adopts a new integration testing strategy—moving from end-to-end tests in a shared environment to contract tests in isolated environments—the impact of that change on change failure rate and MTTR can be measured directly from DevOps Insights data, controlling for deployment frequency and application complexity. This kind of empirical comparison between delivery approaches is exactly what the DORA research programme does at scale across thousands of organisations; DevOps Insights makes it possible within a single organisation and its own specific context.
The quarterly DevOps performance review provides a structured cadence for synthesising DORA metric trends into organisational decisions. Unlike a project status review, which typically measures progress against plan, a DevOps performance review measures the health of the delivery system itself: is deployment frequency increasing or decreasing? Is lead time shortening? Is change failure rate within target? Is MTTR trending up or down? For sovereign cloud estates, the review should also include sovereign quality dimensions: SBOM completeness rates, licence compliance findings, sovereignty constraint check results, and any quality gate overrides that occurred since the previous review.
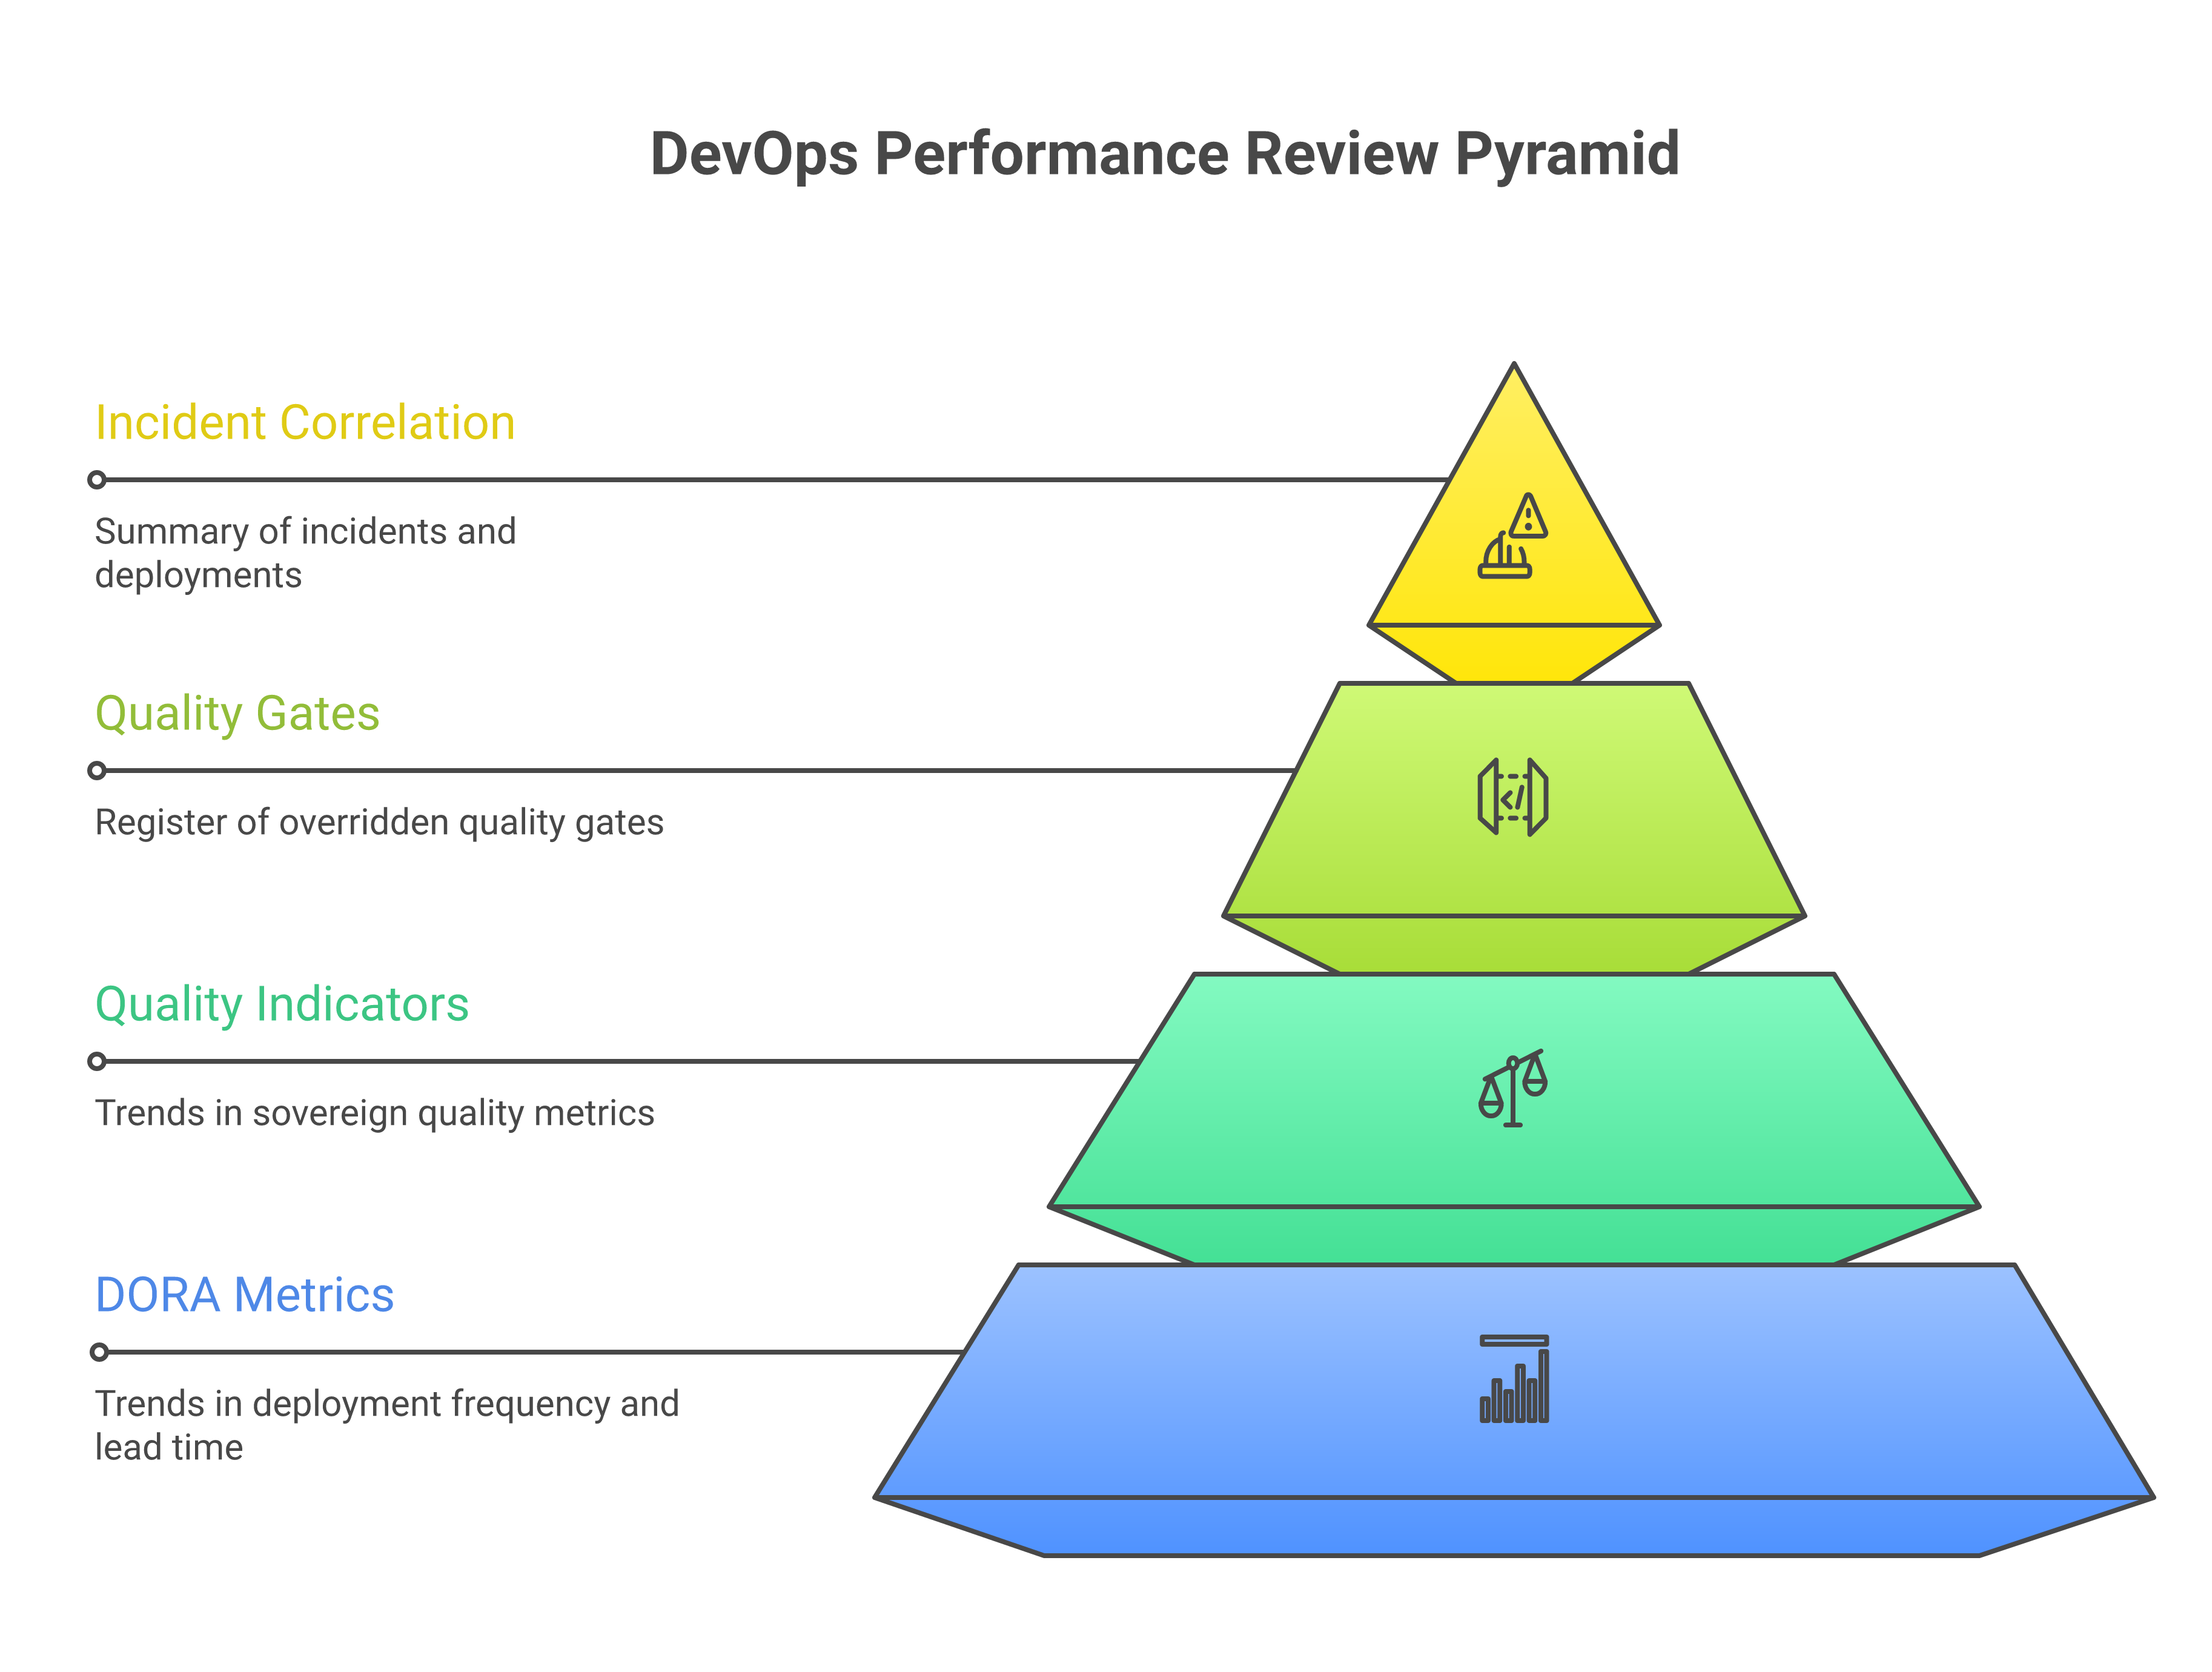
The rhythm of the quarterly review creates accountability for delivery quality at an organisational level, not merely at the level of individual teams. Teams that are under pressure to deliver new features quickly will sometimes make local decisions—accepting a quality gate override, deferring a security finding, reducing test coverage on an unfamiliar module—that are individually defensible but collectively degrade the health of the delivery system. The quarterly review, drawing on DevOps Insights data, makes these local decisions visible in aggregate and enables leadership to ask whether the trade-offs being made at team level are consistent with the organisation’s risk appetite.
Agentic consumption of DevOps Insights data
The operational learning described above has traditionally relied on human engineers—incident commanders reviewing deployment timelines, platform architects analysing trend dashboards, delivery managers compiling quarterly review presentations. The emergence of agentic operations, in which AI agents participate in operational workflows as described in Chapter 14 and Chapter 15, introduces a new class of consumer for DevOps Insights data: autonomous agents that query, correlate and act upon delivery performance signals without waiting for a human to formulate the right question.
An agent operating within Concert’s agentic framework can subscribe to the DevOps Insights event stream and receive notification of every deployment, quality gate evaluation and DORA metric recalculation as it occurs. When such an agent detects that a deployment has landed in a sovereign production environment with an elevated change risk score, it can immediately initiate a set of preparatory actions: verifying that rollback automation is armed for the affected service, confirming that the on-call engineer has been notified, and opening a monitoring session with tightened SLO evaluation thresholds. None of these actions requires a human to notice the elevated score and decide what to do about it; the agent applies a pre-approved runbook encoded as policy.
More sophisticated agentic patterns involve cross-domain correlation that would be impractical for human operators to perform in real time. An agent with access to both DevOps Insights and the observability plane can correlate a deployment event with the subsequent telemetry trajectory of the affected service—latency, error rate, resource consumption—and determine within minutes whether the deployment is tracking the expected post-deployment baseline or deviating from it. If deviation is detected, the agent can escalate to a human operator with a structured summary that includes the deployment details, the quality gate results, the change risk score and the specific telemetry signals that triggered concern. The human operator receives not a raw alert but a contextualised assessment that dramatically reduces the time required to form a diagnostic hypothesis.
Guardrails on agentic consumption are essential, particularly in sovereign environments where automated actions carry regulatory consequence. Agents that consume DevOps Insights data must operate within clearly defined authority boundaries: they may query freely, they may correlate and summarise, they may initiate pre-approved preparatory actions, but they must not autonomously execute destructive remediation—such as rolling back a deployment or scaling down a service—without human approval unless the action falls within an explicitly sanctioned automation policy. These guardrails are themselves expressed as policy-as-code and are subject to the same review and audit processes as quality gate configurations.
This is, ultimately, what continuous quality means in practice: not a static set of rules enforced at a gate, but a living feedback loop in which delivery performance data informs operational risk assessment, operational incidents inform delivery risk scoring, and both inform the organisational decisions that shape what the next quarter’s delivery system looks like.
16.8 Toolchain federation across sovereign zones
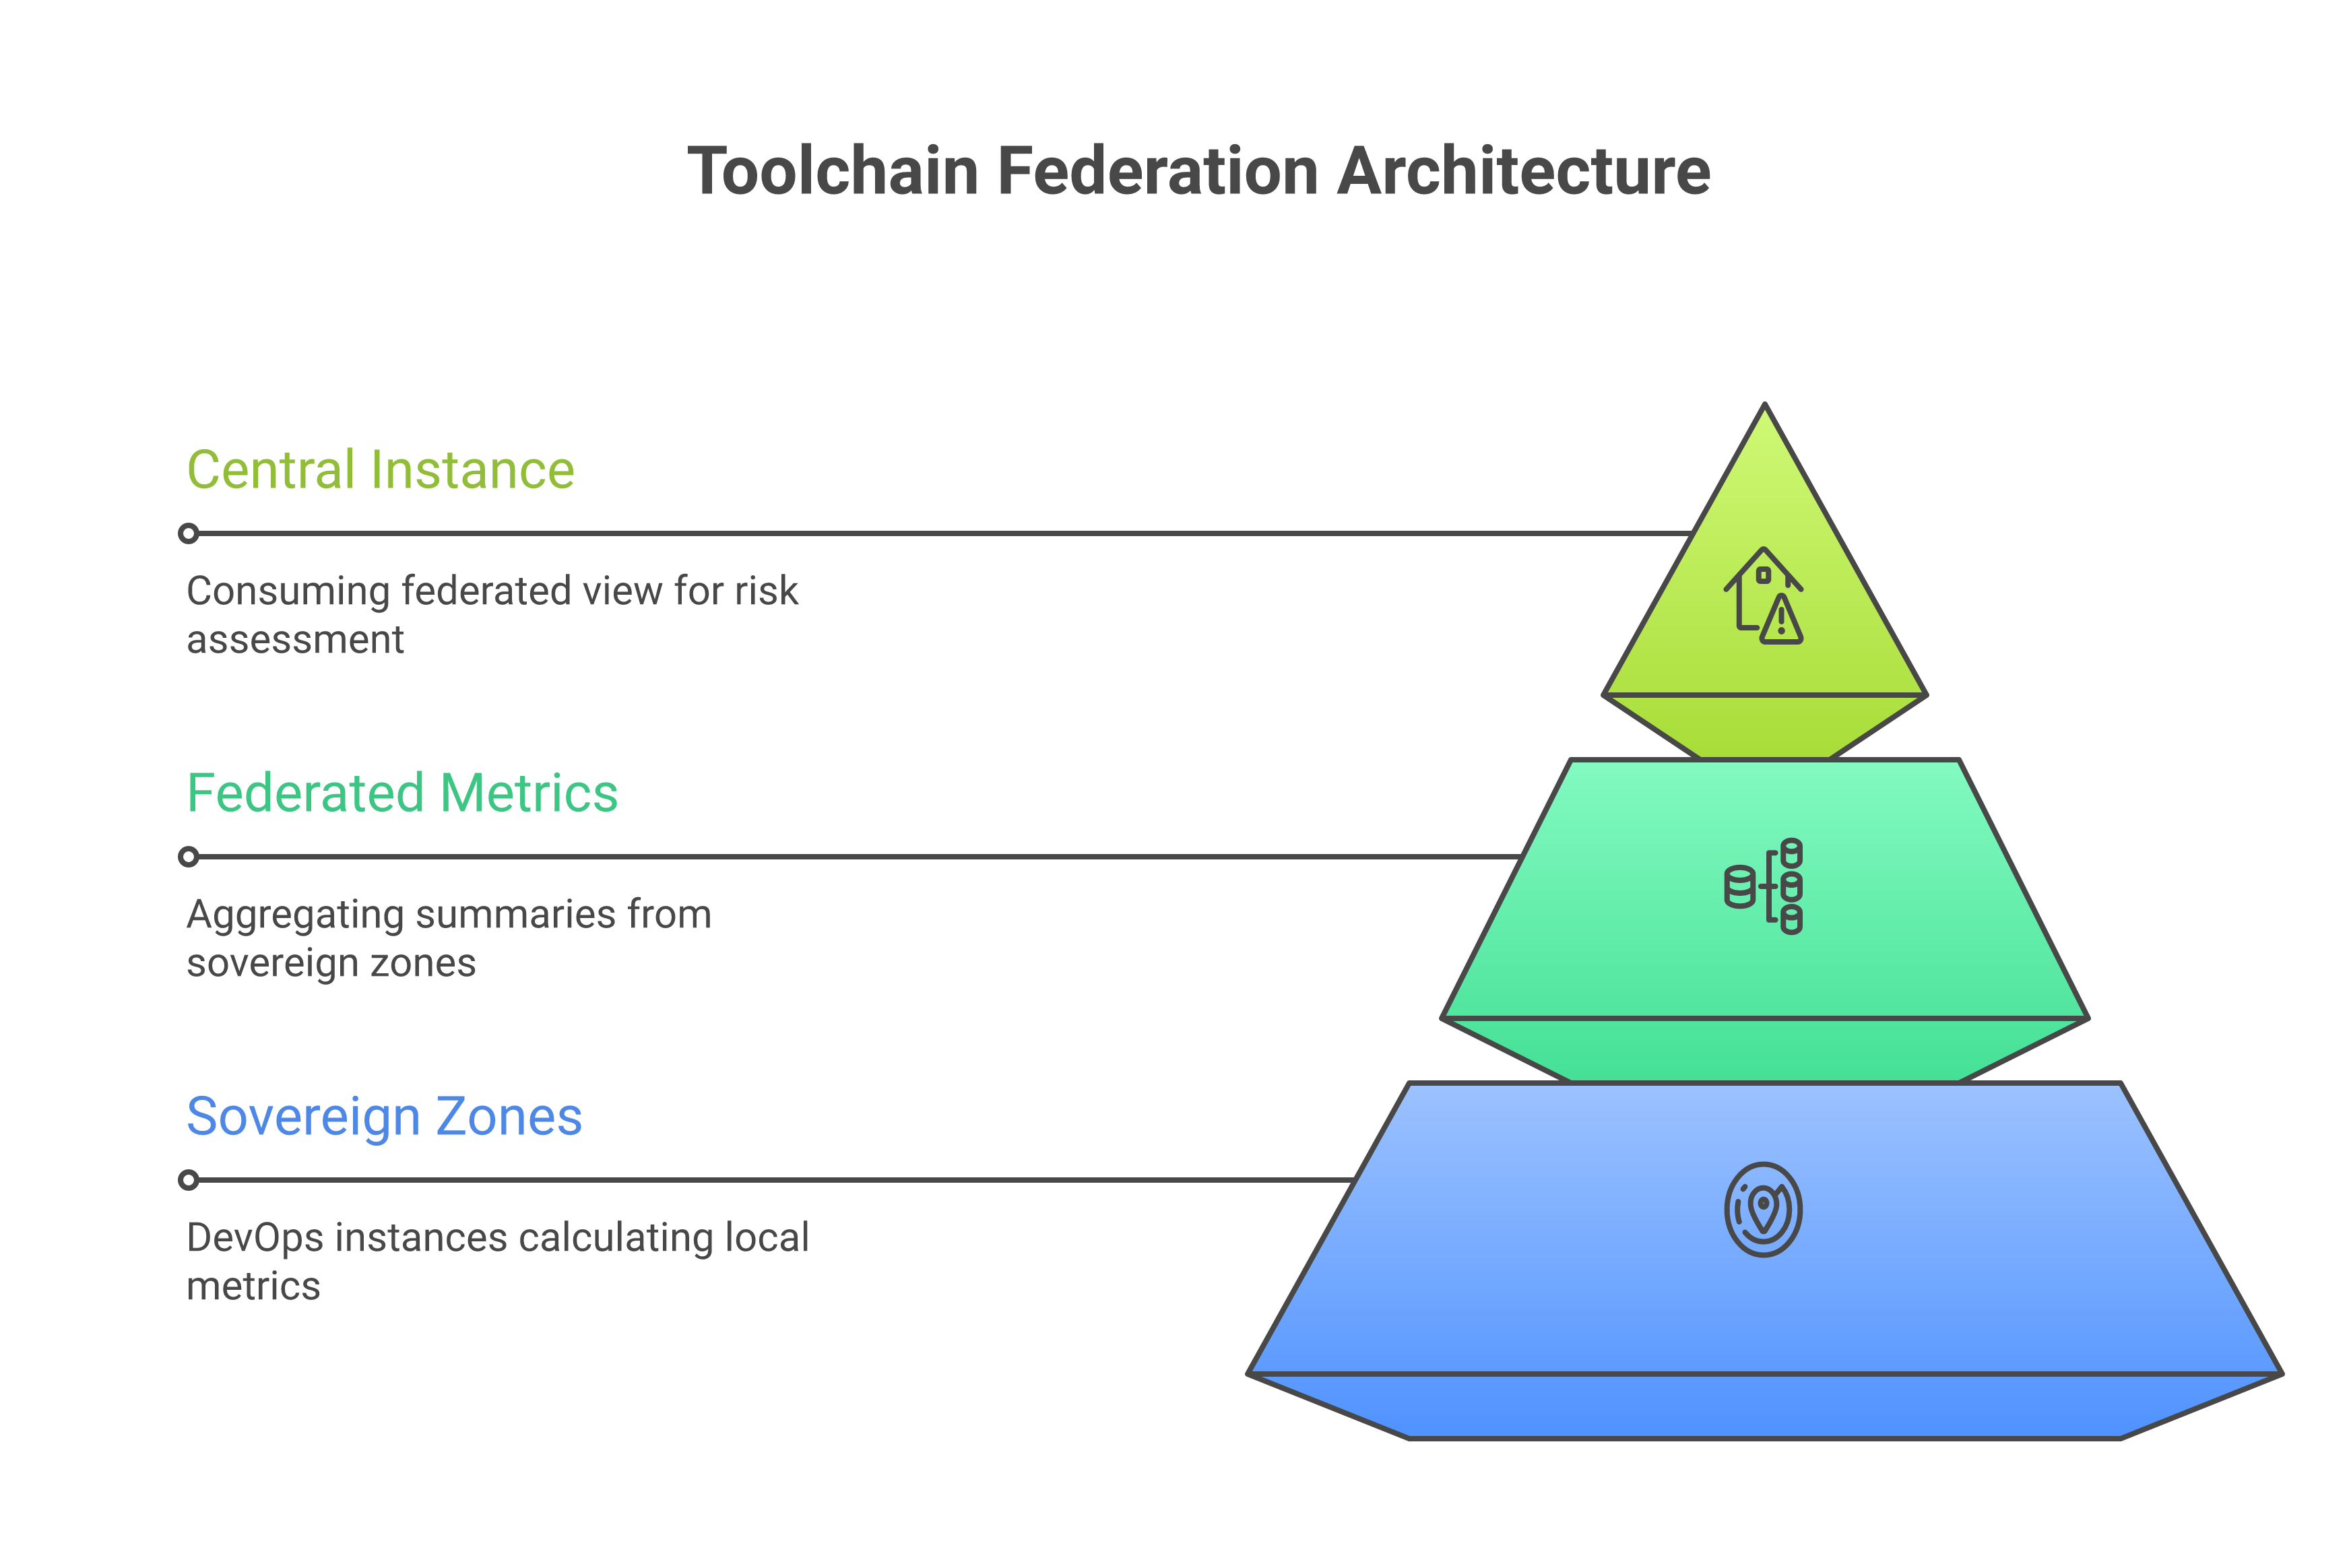
Large sovereign cloud estates rarely operate a single, centralised CI/CD toolchain. Regulatory requirements, data residency constraints and organisational structure typically result in multiple DevOps Insights instances—one per sovereign zone or per regulatory jurisdiction—each collecting build, test and deployment data from the toolchains operating within its boundary. The operational challenge is to derive estate-wide visibility from these distributed instances without violating the data residency rules that necessitated the distribution in the first place.
Toolchain federation addresses this challenge through a pattern of metric aggregation that keeps raw data local while making derived indicators available centrally. Each sovereign zone’s DevOps Insights instance calculates DORA metrics, quality gate pass rates and change risk scores locally, using only the data resident within that zone. These calculated metrics—which are statistical summaries rather than raw records—are then published to a federated metrics plane that Concert’s central instance can query. The federated metrics plane receives no build logs, no test result details, no source code references and no deployment artefact identifiers; it receives only the aggregate indicators that Concert needs to construct an estate-wide quality picture.
This zero-copy integration pattern is architecturally analogous to the federated observability patterns described in Chapter 8 for network and infrastructure telemetry. The principle is the same: operational sovereignty demands that raw operational data remain within the sovereign boundary, but organisational effectiveness demands that leadership have visibility across sovereign boundaries. The resolution is to distinguish between data and insight, keeping the former local and federating the latter.
In practice, the federation mechanism operates through a scheduled export from each DevOps Insights instance. At a configurable interval—hourly for high-velocity estates, daily for those with lower deployment frequency—each instance calculates the current values of its DORA metrics, the quality gate pass/fail ratios, the distribution of change risk scores, and the sovereign quality indicator summaries (SBOM completeness rates, vulnerability finding counts by severity, licence compliance status). These values are serialised as a structured JSON document and transmitted to the federated metrics plane over a mutually authenticated, encrypted channel. The federated plane stores these summaries with provenance metadata—which zone produced them, at what time, covering what evaluation window—and exposes them through an API that Concert’s central assessment engine consumes.
The benefit for operational governance is substantial. A chief technology officer or head of platform engineering can review a single Concert dashboard that shows DORA metric trends across every sovereign zone in the estate, identifying zones where deployment frequency is declining, change failure rates are rising or quality gate override rates are increasing—without ever accessing the underlying data that produced those metrics. Regulatory auditors can be shown that the federation mechanism transmits only aggregate statistics and that no raw build, test or deployment data leaves its sovereign zone of origin.
Key Takeaways
-
The traditional separation between delivery performance and operational stability is empirically unfounded: the DORA research programme demonstrates that elite organisations achieve high throughput and high stability simultaneously, through shared practices and shared telemetry.
-
The four DORA key metrics—deployment frequency, lead time for changes, MTTR and change failure rate—are outcome metrics that resist gaming and provide an evidence-based view of delivery system health; a fifth metric, reliability measured as SLO attainment percentage, links them explicitly to operational outcomes.
-
IBM DevOps Insights integrates with Jenkins, GitHub Actions, GitLab CI and Tekton to collect build, test and deployment data, and exposes DORA metric calculations and quality gate evaluations through a REST API that Concert queries during its assessment cycles.
-
Quality gates in DevOps Insights evaluate accumulated evidence from the delivery process—test coverage, security scan results, policy compliance—before a build is promoted; they complement OPA/Rego admission control, which evaluates structural and runtime compliance after a deployment is attempted.
-
The Concert–DevOps Insights integration creates a bi-directional feedback loop: delivery risk scores inform Concert’s operational risk assessments, and Concert’s incident findings feed back into DevOps Insights change risk scoring, producing a unified risk view across delivery and operations.
-
Sovereign cloud estates require additional quality dimensions beyond the standard DORA framework: SBOM completeness, dependency vulnerability status, licence compliance and sovereignty constraint compliance, all of which can be embedded in DevOps Insights through custom quality indicators and evaluated at quality gates.
-
Delivery history data accumulated in DevOps Insights enables structured operational learning through post-incident deployment correlation, trend analysis of deteriorating quality indicators, A/B comparison of testing strategies, and quarterly DevOps performance reviews that create organisational accountability for delivery system health.
-
Agentic consumers of DevOps Insights data can correlate deployment events with runtime telemetry in real time, initiate pre-approved preparatory actions when change risk scores are elevated, and provide human operators with contextualised assessments rather than raw alerts—subject to guardrails that prevent unsanctioned autonomous remediation.
-
Toolchain federation enables estate-wide visibility across multiple sovereign zones by publishing only aggregate DORA metrics and quality indicator summaries to a federated metrics plane, preserving data residency through a zero-copy integration pattern that keeps raw build, test and deployment data within its sovereign boundary of origin.
Bridge to Chapter 17 — watsonx Orchestrate Conversational Interface
The previous sections have established how delivery pipeline telemetry, when integrated with Concert’s operational intelligence, creates a continuous quality signal that spans the full arc from code commit to production behaviour. This signal is rich, but it is passive: it describes and assesses, but it does not act.
The next step in building a sovereign cloud operations capability is to connect this enriched situational awareness to intelligent automation—systems that can not only identify what should be done but help coordinate the work required to do it. That is the domain of IBM watsonx Orchestrate.
Where DevOps Insights and Concert together produce a continuously updated map of delivery quality and operational risk, watsonx Orchestrate provides the orchestration layer that translates items on that map into coordinated action: dispatching work to the right teams and tools, managing the sequencing of remediation steps across organisational boundaries, and maintaining an auditable record of what was decided, by whom, and on what basis. For sovereign cloud estates, where the chain of accountability for every operational decision must be traceable through to regulatory evidence, this orchestration layer is not a convenience but an architectural necessity.
Chapter 17 examines watsonx Orchestrate’s architecture, its integration with Concert and DevOps Insights, and the patterns by which it enables sovereign cloud operations teams to move from insight to action without sacrificing the governance discipline that their regulatory context demands.
References
[1] N. Forsgren, J. Humble and G. Kim, Accelerate: The Science of Lean Software and DevOps. Portland, OR: IT Revolution Press, 2018. [Online]. Available: https://itrevolution.com/product/accelerate/
[2] DORA, “State of DevOps Report 2023,” Google LLC, 2023. [Online]. Available: https://dora.dev/research/2023/dora-report/
[3] IBM Corporation, “IBM DevOps Insights documentation,” IBM Cloud Docs, 2024. [Online]. Available: https://cloud.ibm.com/docs/ContinuousDelivery?topic=ContinuousDelivery-di_working
[4] M. Dodson, A. Delaitre, K. Scarfone, B. Souppaya and C. Turner, “Secure Software Development Framework (SSDF) Version 1.1: Recommendations for Mitigating the Risk of Software Vulnerabilities,” National Institute of Standards and Technology, Gaithersburg, MD, NIST SP 800-218, Feb. 2022. [Online]. Available: https://doi.org/10.6028/NIST.SP.800-218
[5] CycloneDX Project, “CycloneDX Specification,” OWASP Foundation, 2023. [Online]. Available: https://cyclonedx.org/specification/overview/
[6] Linux Foundation, “SPDX Specification Version 2.3,” The Linux Foundation, 2022. [Online]. Available: https://spdx.github.io/spdx-spec/v2.3/
[7] DORA, “State of DevOps Report 2022,” Google LLC, 2022. [Online]. Available: https://dora.dev/research/2022/dora-report/
Sovereign Cloud Operations: AI-Driven Management of Sovereign Estates
© 2026 by Alan Hamilton
is licensed under CC BY-SA 4.0


